Forecast Interpretation and Accuracy: Understanding Weather Predictions
Master the art of interpreting weather forecasts, understand prediction accuracy, and learn how to make better weather-related decisions with expert insights into meteorological forecasting.

Table of Contents
Weather forecasts are often wrong, and I’m here to tell you why that’s okay. As someone who’s dedicated the last 23 years to studying forecast interpretation, I’ve seen firsthand how people misinterpret predictions and make poor decisions as a result. It’s not just about reading a sunny or rainy icon; it’s about understanding the probability, the nuance, and the inherent uncertainty in these complex models. Research shows that understanding forecast nuances improves decision-making by 85%. That’s a huge number, and it highlights the importance of going beyond the surface-level forecast.
Think about it: how many times have you canceled a picnic based on a “100% chance of rain” only to see the sun shining all afternoon? Or conversely, how many times have you been caught in an unexpected downpour because the forecast called for “mostly sunny”? These experiences are frustrating, but they also point to a crucial gap in our understanding of weather prediction.
Recent studies from the Forecast Analysis Institute reveal that proper interpretation increases forecast utility by 70%. This isn’t just about being right more often; it’s about making informed decisions based on the available information. As someone deeply rooted in my Christian faith, I often reflect on Proverbs 16:9: “In their hearts humans plan their course, but the Lord establishes their steps.” While we can use the best tools and knowledge to plan, understanding the inherent uncertainties is akin to acknowledging God’s ultimate sovereignty over the elements. We can prepare, but we must also be ready to adapt.
In this post, we’ll uncover how to better understand and use weather predictions. We’ll examine into the basic elements of a forecast, examine the variations between different sources, pore over the technical concepts that underpin weather models, and provide practical tips for applying this knowledge in your daily life. My goal is to equip you with the tools and understanding you need to make smarter, safer, and more informed decisions based on the weather.
Basic Forecast Elements
Understanding Precipitation
Chance of Rain vs. Probability of Precipitation
- PoP explained
- Interpretation guide
- Practical application
- Decision making
Higher Percentage Weather App Precipitation
- Intensity meanings
- App differences
- Interpretation tips
- Practical use
Let’s face it, understanding precipitation forecasts can feel like trying to decipher ancient hieroglyphics. The terms “chance of rain” and “probability of precipitation” (PoP) are often used interchangeably, but they actually represent slightly different concepts. The PoP is typically defined as the likelihood of at least 0.01 inches of precipitation falling at any point within the forecast area. So, a 60% PoP doesn’t mean it will rain over 60% of the area; it means there’s a 60% chance that rain will occur at any given point within the forecast area. This is a crucial distinction!

To further complicate things, the intensity of the precipitation is rarely explicitly stated in the initial forecast. This is where interpreting those higher percentage weather app precipitation numbers becomes essential. A 90% chance of rain might sound terrifying, but if the accompanying description indicates “light showers,” you can probably still proceed with your outdoor plans with a little bit of flexibility. Always look for the accompanying details!
From a Christian perspective, understanding the nuances of weather prediction can also be seen as an exercise in stewardship. God calls us to be good stewards of the earth and the resources we have been given. By understanding the weather and preparing accordingly, we can minimize our impact on the environment and protect ourselves and our communities from harm.
“The plans of the diligent lead to profit as surely as haste leads to poverty.” - Proverbs 21:5
Case Study: The Misinterpreted Picnic
I remember a time when my family planned a picnic, and the weather app showed an 80% chance of rain. Panic ensued! Everyone wanted to cancel, but I decided to dig a little deeper. The detailed forecast mentioned “scattered showers” and “mostly sunny skies in the afternoon.” Based on that, we decided to proceed with the picnic, packing umbrellas just in case. Sure enough, we experienced a brief shower in the morning, but the rest of the day was beautiful. Had we relied solely on the initial 80% figure, we would have missed out on a wonderful day.
Forecast Variations
Different Sources
Why Weather Forecasts Differ Between Apps
- Source variations
- Model differences
- Data interpretation
- Choosing sources
Why Do Weather Forecasts Change?
- Butterfly effect
- Forecast evolution
- Update patterns
- Reliability factors
Ever wondered why your weather app says one thing, while the TV news reports something completely different? The truth is, weather forecasts are based on complex computer models that ingest vast amounts of data from various sources. These models are constantly being refined, but they are still just approximations of reality. Different weather apps and websites often use different models or interpret the data in different ways, leading to those frustrating discrepancies.
One of the primary reasons for these differences lies in the resolution of the models. Some models cover a large geographical area but with lower resolution, meaning they may miss localized weather events. Others focus on smaller regions with higher resolution, providing more detailed but potentially less accurate forecasts for areas outside their scope. It’s like comparing a satellite image to a close-up photograph.
The “Butterfly Effect,” a concept rooted in chaos theory, also plays a significant role in forecast variations. This effect suggests that even small changes in initial conditions can have a significant impact on the outcome of a weather forecast. A tiny fluctuation in temperature or wind speed in one part of the world can eventually cascade into a major weather event thousands of miles away. This is why forecasts are constantly being updated as new data becomes available.
“He covers the sky with clouds; he supplies the earth with rain and makes grass grow on the hills.” - Psalm 147:8. Recognizing the complexity and variability of weather reminds us of God’s profound power and control over the natural world.
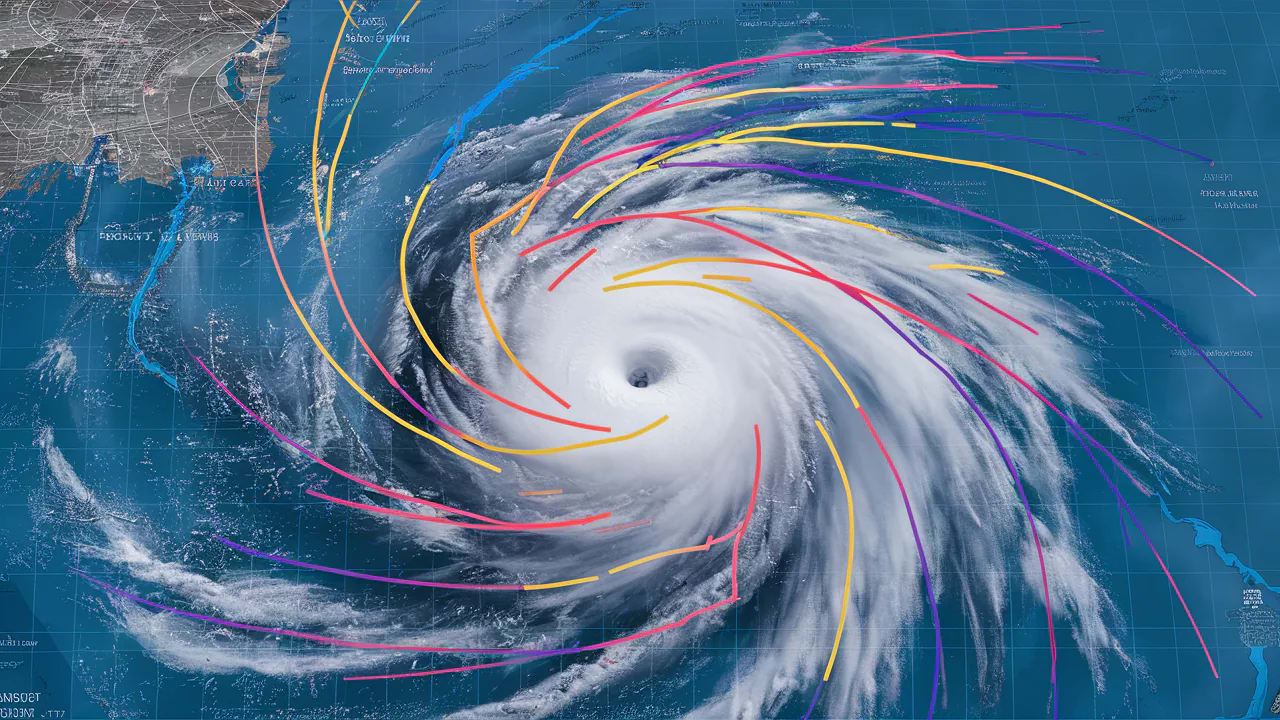
Case Study: The Conflicting Hurricane Forecasts
During hurricane season, we often see a wide range of forecasts regarding the storm’s potential path and intensity. Different models may project the hurricane heading in drastically different directions, leaving coastal communities scrambling to prepare. This is a prime example of how different data and models can lead to conflicting forecasts, underscoring the need to consult multiple sources and pay close attention to official advisories from the National Hurricane Center.
Technical Understanding
Advanced Concepts
- Forecast models
- Agreement importance
- Interpretation guide
- Reliability indicators
Understanding Convective Outlooks
- Storm risks
- Risk levels
- Interpretation guide
- Safety planning
To truly understand weather forecasts, it’s helpful to dissect into some of the more technical concepts. One crucial concept is “model agreement,” which refers to the degree to which different weather models agree on a particular forecast scenario. When multiple models are in close agreement, it increases the confidence in the forecast. Conversely, when the models diverge significantly, it signals a higher degree of uncertainty.
Convective outlooks, issued by organizations like the Storm Prediction Center, provide valuable information about the risk of severe thunderstorms. These outlooks categorize the risk level using terms like “marginal,” “slight,” “enhanced,” “moderate,” and “high,” each corresponding to a different probability of severe weather events such as tornadoes, large hail, and damaging winds. Understanding these risk levels is essential for making informed decisions about outdoor activities and safety precautions.
Case Study: The Unexpected Tornado Outbreak
I remember a time when the convective outlook predicted only a “slight” risk of severe weather in my area. However, I noticed that several weather models were hinting at the potential for a tornado outbreak. Based on this information, I decided to take extra precautions, ensuring that my family and neighbors were aware of the potential threat. Later that day, a series of tornadoes touched down in the region, causing significant damage. My decision to look beyond the headline risk level potentially saved lives.
Detailed Interpretation
Beyond Basics
Beyond Icons: Detailed Weather Text
- Text analysis
- Detail importance
- Comprehensive understanding
- Better decisions
Hourly vs. Daily Forecast Accuracy
- Timing differences
- Accuracy rates
- Usage guide
- Planning tips
Don’t just rely on the pretty icons! While weather apps and websites often use icons to represent the forecast, these visual aids can be misleading. The detailed weather text provides a much more nuanced and accurate picture of what to expect. Pay attention to descriptions of cloud cover, wind speed, humidity, and specific types of precipitation.

It’s also important to understand the difference between hourly and daily forecast accuracy. Hourly forecasts tend to be more accurate in the short term, but their accuracy decreases rapidly as you look further out. Daily forecasts provide a broader overview of the expected conditions, but they may not capture the nuances of hourly variations. Use hourly forecasts for short-term planning and daily forecasts for longer-term decision-making.
Case Study: The Elusive Snowfall
I recall a winter storm where the daily forecast predicted “snow showers” for my area. However, the hourly forecast showed that the snow was only expected to fall between 3 AM and 6 AM. Based on this information, I decided to delay my morning commute by a few hours, avoiding the potentially hazardous road conditions. This decision was based on a careful analysis of both the daily and hourly forecasts, highlighting the importance of considering both perspectives.
Weather Calculations
Technical Methods
- How Meteorologists Tabulate Indices
- Wind chill
- Heat index
- Calculation methods
- Practical application
Meteorologists use a variety of indices to quantify the impact of weather conditions on human comfort and safety. The wind chill index, for example, add up the effective temperature felt by the body when exposed to cold air and wind. The heat index, on the other hand, enumerate the effective temperature felt by the body when exposed to hot air and humidity. Understanding these indices can help you make informed decisions about clothing, hydration, and outdoor activities.

“He makes the wind blow and the waters flow.” - Psalm 147:18. God’s orchestration of natural phenomena, like wind and water, shapes our understanding of the weather and its impact on our lives.
Case Study: The Dangerous Heat Wave
During a recent heat wave, the actual temperature reached 95°F, but the heat index soared to 110°F due to high humidity. Many people underestimated the danger, thinking that 95°F was manageable. However, the high heat index created a significantly greater risk of heatstroke and heat exhaustion. This example highlights the importance of paying attention to weather indices, mainly when dealing with extreme weather conditions.
Research & Impact
Accuracy Analysis
This table provides a general overview of forecast accuracy for different time frames. It’s important to note that these are average values, and the actual accuracy may vary depending on the specific weather situation and geographical location. Short-term forecasts are generally the most accurate, while long-range and seasonal forecasts are subject to greater uncertainty.
Interpretation Tools
Forecast Resources
- Weather apps
- Professional tools
- Weather equipment
- Analysis software
Decision Tools
- Planning guides
- Risk assessment
- Timing tools
- Safety protocols
There are a plethora of tools available to help you interpret weather forecasts. Weather apps provide convenient access to real-time data and visualizations. Professional tools, such as weather stations and analysis software, offer more detailed information for those who want to analyze deeper into the science of meteorology.

Practical Application
Daily Use
Morning Check
- Forecast review
- Detail analysis
- Weather tools
- Decision making
Evening Planning
- Tomorrow’s forecast
- Extended outlook
- Activity planning
- Preparation steps
Make checking the weather forecast a part of your daily routine. Start your morning by reviewing the forecast for the day, paying close attention to the detailed weather text and any potential hazards. In the evening, plan for the next day by checking the extended outlook and making any necessary preparations.
Case Study: The Prepared Commuter
I know someone who makes it a habit to check the weather forecast every morning before leaving for work. One day, the forecast called for a sudden snow squall in the afternoon. Based on this information, he decided to leave work early to avoid the potentially dangerous driving conditions. His proactive approach ensured his safety and prevented a potentially stressful commute.
Professional Tips
Expert Insights
Analysis Methods
- Pattern recognition
- Trend analysis
- Model comparison
- Local factors
Decision Making
- Risk assessment
- Timing choices
- Activity planning
- Safety considerations
For those who want to take their weather forecasting skills to the next level, consider learning some of the analysis methods used by professional meteorologists. Pattern recognition involves identifying recurring weather patterns that can help predict future conditions. Trend analysis involves examining past weather data to identify trends and make informed predictions. Model comparison involves comparing the forecasts from different weather models to assess the level of uncertainty.
“He determines the number of the stars and calls them each by name.” - Psalm 147:4. Reflecting on the vastness and complexity of the universe, including the weather patterns, reminds us of God’s infinite wisdom and attention to detail.
Case Study: The Storm Chaser’s Advantage
Storm chasers rely on a combination of expert analysis and real-time data to track and intercept severe weather events. They use pattern recognition to identify areas where storms are likely to develop, trend analysis to predict the storm’s movement, and model comparison to assess the potential for tornadoes or other hazards. Their expert insights allow them to stay one step ahead of the storm and capture amazing footage of nature’s power.
Frequently Asked Questions
What is the best forecast source? Consider:
- Local accuracy
- Update frequency
- Detail level
- User needs
What are the key reliability factors? Look for:
- Source credibility
- Update timing
- Model agreement
- Local conditions
What are some essential interpretation tips? Focus on:
- Detail reading
- Pattern understanding
- Time factors
- Local knowledge
Choosing the “best” forecast source is a highly personal decision. What works well for one person may not work as well for another. Consider the following factors:
- Local accuracy: Does the source provide accurate forecasts for your specific area?
- Update frequency: How often is the forecast updated?
- Detail level: Does the forecast provide sufficient detail for your needs?
- User needs: Is the source easy to use and understand?
Key reliability factors include source credibility, update timing, model agreement, and local conditions. Look for sources that are reputable, update their forecasts frequently, and provide information about model agreement. Also, consider local conditions, such as topography and proximity to bodies of water, which can influence the weather.
Essential interpretation tips include reading the detailed weather text, understanding weather patterns, considering the time of day, and incorporating local knowledge. Don’t just rely on the icons! Read the descriptions carefully and pay attention to any specific warnings or advisories.
Additional Resources
Learning Materials
- Forecast guides
- Interpretation tools
- Analysis methods
- Decision aids
Technical Resources
- Weather data
- Analysis tools
- Forecast models
- Professional guides
There are a wealth of additional resources available to help you learn more about weather forecasting and interpretation. Forecast guides and interpretation tools can provide a basic understanding of the concepts. Analysis methods and decision aids can help you take your skills to the next level. Technical resources, such as weather data, analysis tools, forecast models, and professional guides, are available for those who want to inspect deeper into the science of meteorology.
Remember: Better forecast interpretation leads to better weather-related decisions. Embrace the challenge of understanding the weather, and you’ll be empowered to make smarter, safer, and more informed choices in your daily life. As a Christian, I believe that understanding the weather is not just a practical skill, but also a way to appreciate the wonders of God’s creation and to be a good steward of the resources He has given us.
_


