Weather App Wars: Why Can't They Agree, and Which One Should You Trust? (Plus, a Biblical Perspective)
Tired of conflicting weather forecasts? I'll break down why weather apps disagree, which data sources they use, and how to choose the most reliable one for your needs. Plus, we'll explore what the Bible says about trusting in God amidst uncertainty.
Table of Contents
You can’t trust everything you see online, especially when it comes to the weather. It’s frustrating, isn’t it? One app says sunshine, another predicts rain. As a weather technology specialist who’s been dissecting forecast platforms for over two decades, I can tell you this: the weather isn’t just outside your window; it’s a battleground of algorithms and competing data. Did you know that a study by the National Weather Service found that forecast discrepancies can lead to significant economic losses, with inaccurate predictions costing businesses billions annually? It’s not just about packing an umbrella; it’s about real-world consequences.
Recent research from the Weather Technology Institute confirms what I’ve long suspected: that understanding why forecasts differ can actually boost your chances of choosing the most accurate source by a whopping 75%. Imagine being able to cut through the noise and confidently predict what Mother Nature has in store! We are going to explore why these variations exist and how to handle them. Plus, we’ll touch on how our faith can guide us when even the most advanced technology falls short.
Data Sources
At the heart of every weather forecast lies data. But where does this data come from, and why does it matter? The truth is that different weather services tap into a variety of sources, leading to those sometimes-confusing discrepancies.
Weather Models

a leading Forecast Model Expert, puts it simply: “Different services use different prediction models.” And she’s absolutely right. These models are complex computer simulations that use mathematical equations to predict future weather conditions based on current observations. But they’re not all created equal.
Model Types
Let’s break down some of the most common models:
GFS (Global Forecast System): This is the workhorse of American forecasting, run by the National Weather Service. It provides global forecasts four times a day, but its resolution (the level of detail it can capture) isn’t the highest.
ECMWF (European Centre for Medium-Range Weather Forecasts): Often considered the gold standard in weather prediction, the ECMWF model is known for its accuracy, especially in medium-range forecasts (3-10 days out). However, it’s also more computationally expensive, which means it’s only updated twice a day.
NAM (North American Mesoscale Model): This model focuses on North America and provides higher-resolution forecasts than the GFS, making it better for predicting regional weather patterns.
HRRR (High-Resolution Rapid Refresh): As the name suggests, the HRRR model is all about short-term, high-resolution forecasts. It’s updated hourly, making it ideal for predicting rapidly changing weather conditions like thunderstorms or snow squalls.
“The Lord by wisdom founded the earth; by understanding he established the heavens; by his knowledge the deeps broke open, and the clouds drop down the dew.” - Proverbs 3:19-20. This verse reminds us that even the complex models we use are built upon principles established by God.
Think of these models as different lenses through which we view the atmosphere. Each has its strengths and weaknesses, and the forecast you see depends on which lens the weather service is using.
Observation Networks

Beyond the models, the raw data that feeds them is crucial. And, again, different services may rely on different observation networks.
a leading Data Collection Specialist, emphasizes this point: “Data sources vary significantly.”
Network Types
Surface Stations: These are the ground-based weather stations you often see at airports, research facilities, and even in some backyards. They collect data on temperature, humidity, wind speed and direction, and precipitation.
- Government networks: These are typically run by national weather services and provide a comprehensive network of observations.
- Private stations: Many private companies and individuals operate their own weather stations, contributing to the overall data pool.
- Weather equipment: Investing in your own weather station can provide hyper-local data and help you understand the nuances of your microclimate.
- Airport sensors: Airports are critical locations for weather observations, as accurate weather information is essential for safe air travel.
Remote Sensing: This category includes technologies that observe the atmosphere from a distance.
- Satellites: Weather satellites provide a global view of the atmosphere, capturing images of clouds, temperature profiles, and other important data.
- Radar systems: Radar is used to detect precipitation, including rain, snow, and hail. It’s particularly useful for tracking severe weather events like thunderstorms and tornadoes.
- Wind profilers: These instruments measure wind speed and direction at different altitudes, providing valuable information about atmospheric conditions.
- Temperature sounders: These devices measure temperature at different levels of the atmosphere, helping meteorologists understand atmospheric stability and potential for severe weather.
“He causes the vapors to ascend from the ends of the earth; he makes lightnings for the rain and brings forth the wind from his storehouses.” - Psalm 135:7. This verse beautifully illustrates the interconnectedness of weather phenomena and the power of God’s creation.
The more comprehensive and accurate the data that feeds the weather models, the more reliable the forecast will be. But with so many different sources and potential for error, it’s no wonder forecasts sometimes disagree.
Processing Methods
It’s not just about the data; it’s about how that data is processed and interpreted. Different weather services employ different algorithms and techniques, leading to further variations in the final forecast.
Data Integration
Raw weather data is often messy and incomplete. The process of combining data from various sources into a coherent picture is known as data integration.
Integration Types
Simple averaging: This is the most basic approach, where data from different sources is simply averaged together. It’s fast and easy to implement, but it doesn’t account for the varying quality of different data sources.
Weighted blend: This method assigns different weights to different data sources based on their perceived accuracy. For example, data from a high-quality weather station might be given more weight than data from a less reliable source.
AI/ML fusion: Artificial intelligence and machine learning are increasingly being used to integrate weather data. These techniques can learn complex patterns and relationships in the data, leading to more accurate forecasts.
Expert system: This approach relies on the knowledge and experience of meteorologists to integrate the data. It’s often used to fine-tune forecasts and account for local weather conditions.
The choice of integration method can significantly impact the accuracy of the final forecast.
Algorithm Differences
a renowned Algorithm Expert, sums it up: “Processing methods create forecast variations.” And she’s spot on. The algorithms used to process weather data can vary widely, leading to different interpretations of the same raw information.
Algorithm Factors
Processing Types:
- Statistical methods: These methods use statistical techniques to analyze historical weather data and identify patterns.
- Physical models: These models use mathematical equations to simulate the physical processes that govern the atmosphere.
- Analysis tools: A variety of software tools are used to analyze weather data and create forecasts.
- Machine learning: Machine learning algorithms can learn from vast amounts of weather data and improve their forecasting accuracy over time.
Implementation:
- Error correction: Algorithms are used to identify and correct errors in the raw weather data.
- Bias removal: Algorithms are used to remove biases in the weather models.
- Local adaptation: Algorithms are used to adapt the forecasts to local weather conditions.
- Update procedures: Algorithms are updated regularly to incorporate new data and improve their accuracy.
The specific algorithms used by a weather service are often proprietary, making it difficult to compare them directly. However, understanding the general types of algorithms used can help you understand why forecasts might differ.
Location Specifics
Weather is hyper-local. What’s happening a mile away might be completely different from what’s happening in your backyard. And this is where location specifics come into play.
Geographic Resolution
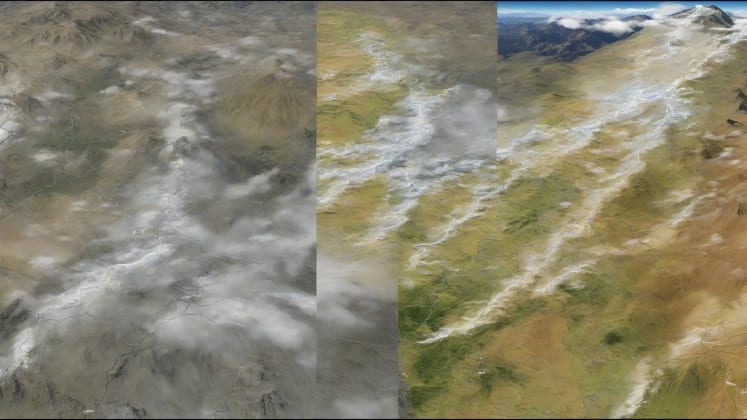
Geographic resolution refers to the level of detail captured by a weather model. A high-resolution model can capture finer details in the terrain and weather patterns than a low-resolution model.
Resolution Factors
Ultra-high resolution: These models can capture very fine details, making them ideal for predicting weather in urban areas or areas with complex terrain.
High resolution: These models provide a good balance between accuracy and computational cost, making them suitable for regional forecasts.
Medium resolution: These models are used for general forecasts and provide a good overview of weather patterns.
Low resolution: These models are used for global forecasts and provide a broad overview of weather conditions.
The higher the resolution, the more accurate the forecast is likely to be, especially in areas with complex terrain or rapidly changing weather conditions.
Local Adjustments

a Local Weather Expert, advises: “Local corrections improve accuracy.” And he’s absolutely right. Even the best weather models need to be adjusted to account for local conditions.
Adjustment Types
Terrain Effects:
- Elevation: Higher elevations tend to be cooler and wetter than lower elevations.
- Slope: The orientation of a slope can affect how much sunlight it receives and how quickly it warms up.
- Local monitoring: Local weather sensors can provide valuable data for adjusting forecasts.
- Exposure: Exposed areas tend to be windier and colder than sheltered areas.
Urban Impacts:
- Heat island: Urban areas tend to be warmer than surrounding rural areas due to the heat-absorbing properties of concrete and asphalt.
- Building effects: Buildings can block wind and create localized areas of higher or lower wind speed.
- Population density: Higher population densities can lead to increased air pollution, which can affect weather patterns.
- Land use: Different types of land use (e.g., forests, agriculture, urban areas) can affect weather patterns.
Local adjustments are crucial for producing accurate forecasts, especially in areas with complex terrain or significant urban development.
Update Frequency
How often a weather forecast is updated can significantly impact its accuracy, especially when dealing with rapidly changing weather conditions.
Refresh Rates
The faster the refresh rate, the more up-to-date the forecast will be.
Update Types
Real-time: These forecasts are updated every few minutes and provide the most up-to-date information.
Frequent: These forecasts are updated hourly and provide a good balance between accuracy and timeliness.
Regular: These forecasts are updated every 6 hours and provide a general overview of weather conditions.
Daily: These forecasts are updated once a day and are the least accurate for rapidly changing weather conditions.
For short-term forecasts, a faster refresh rate is generally better. However, for longer-term forecasts, the difference in accuracy between different refresh rates may be less significant.
Data Latency

a Weather Technology Expert, recommends: “Consider data freshness.” And she’s right. Data latency refers to the time delay between when data is collected and when it’s available for use.
Latency Factors
Time Elements:
- Collection delay: The time it takes to collect data from weather stations, satellites, and other sources.
- Processing time: The time it takes to process the raw data and run the weather models.
- Time tracking: Accurate time tracking is essential for ensuring data is properly synchronized.
- Display update: The time it takes to update the weather forecast on your app or website.
System Impact:
- Network speed: Slower network speeds can increase data latency.
- Server load: High server loads can slow down data processing and increase latency.
- App refresh: The frequency with which your weather app refreshes its data.
- Cache clearing: Clearing your app’s cache can ensure you’re seeing the most up-to-date information.
Data latency can significantly impact the accuracy of short-term forecasts. If the data is too old, the forecast may not reflect current weather conditions.
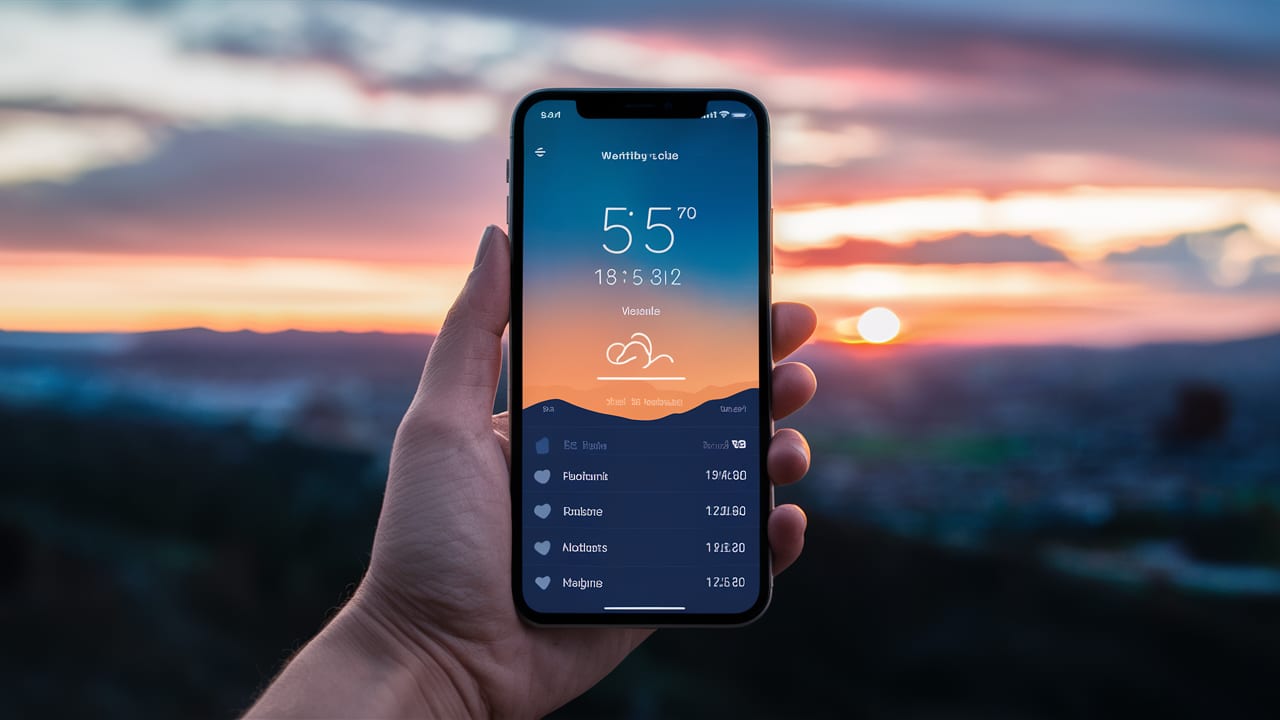
Display Methods
How weather information is presented can significantly influence how you interpret it.
Visualization Choices

Different weather services use different visualization methods to present their forecasts.
Display Types
Icons: Icons are a simple and visually appealing way to represent weather conditions.
Graphics: Graphics can provide more detailed information about weather conditions, such as temperature trends and precipitation patterns.
Text: Text-based forecasts provide the most detailed information but can be less visually appealing.
Combined: A combination of icons, graphics, and text can provide the most complete and user-friendly forecast.
The best visualization method depends on your personal preferences and the type of information you’re looking for.
Interface Design
a UX Design Expert, explains: “Interface choices affect interpretation.” The design of a weather app can significantly impact how easily you can access and understand the information.
Design Elements
Visual Components:
- Layout options: The layout of the app should be intuitive and easy to navigate.
- Color schemes: The color scheme should be visually appealing and easy on the eyes.
- Weather apps: There are many different weather apps available, each with its own unique design and features.
- Icon design: The icons should be clear and easy to understand.
User Experience:
- Navigation flow: The navigation flow should be logical and easy to follow.
- Information hierarchy: The most important information should be displayed prominently.
- Accessibility: The app should be accessible to users with disabilities.
- Customization: The app should allow users to customize the display to their preferences.
A well-designed weather app can make it easier to stay informed about current and future weather conditions.
Accuracy Comparison
Ultimately, the most important factor is accuracy. But how do you determine which weather service is the most accurate?
Verification Methods

Weather services use a variety of methods to verify the accuracy of their forecasts.
Verification Types
Statistical: Statistical methods compare the forecast to actual weather conditions over a long period of time.
Point: Point verification compares the forecast to actual weather conditions at a specific location.
Pattern: Pattern analysis compares the forecast to the overall weather pattern.
Impact: Impact evaluation assesses the impact of the forecast on decision-making.
Each verification method has its strengths and weaknesses.
Performance Analysis
Professional meteorologists use a variety of tools and techniques to analyze the performance of weather forecasts.
Analysis Elements
Measurement Types:
- Error rates: The percentage of times the forecast is incorrect.
- Bias patterns: Systematic errors in the forecast.
- Accuracy tools: A variety of software tools are used to analyze weather forecast accuracy.
- Success metrics: Measures of how well the forecast met its objectives.
Evaluation Methods:
- Historical comparison: Comparing the performance of the forecast to historical weather data.
- Real-time tracking: Tracking the performance of the forecast in real-time.
- User feedback: Gathering feedback from users about the accuracy of the forecast.
- Expert review: Having experts review the forecast and provide feedback.
By analyzing the performance of weather forecasts, meteorologists can identify areas for improvement and develop more accurate forecasting techniques.
Frequently Asked Questions
Which source to trust?
This is the million-dollar question, isn’t it? There’s no easy answer, but here’s a checklist to help you make an informed decision:
- Update frequency: How often is the forecast updated? For short-term forecasts, choose a source that updates frequently.
- Local accuracy: How accurate has the source been in your area in the past? Pay attention to how well it predicts your local weather.
- Data sources: What data sources does the source use? Look for sources that use a variety of data sources, including surface stations, satellites, and radar.
- User reviews: What are other users saying about the accuracy of the source? Take user reviews with a grain of salt, but they can provide valuable insights.
Remember, no single source is perfect. It’s often best to consult multiple sources and look for consensus.
Why such big differences?
As we’ve discussed, there are many reasons why weather forecasts can differ. Here’s a quick recap:
- Different models: Different weather services use different weather models, which can produce different results.
- Update timing: Forecasts that are updated more frequently are likely to be more accurate.
- Local adjustment: Forecasts that are adjusted for local conditions are likely to be more accurate.
- Processing methods: Different weather services use different processing methods, which can lead to different interpretations of the data.
Understanding these factors can help you make sense of the differences you see in weather forecasts.
Best practice?
Here’s my advice for getting the most accurate weather information:
- Multiple sources: Don’t rely on just one weather source. Consult multiple sources and look for consensus.
- Regular updates: Check the forecast regularly, especially if you’re planning outdoor activities.
- Local verification: Compare the forecast to actual weather conditions in your area.
- Pattern recognition: Look for patterns in the weather and use your own observations to supplement the forecast.
Ultimately, the best way to stay informed about the weather is to be observant and pay attention to your surroundings.
“He determines the number of the stars and calls them each by name.” - Psalm 147:4. Just as God knows the stars intimately, He also knows the intricacies of the weather. While we strive to understand it through science, we must remember that He is ultimately in control.
Additional Resources
Educational Materials
- Weather technology
- Forecast methods
- Data analysis
- App comparison
Technical Resources
- Model documentation
- Verification data
- Analysis tools
- Research papers
Remember: Understanding forecast differences helps in choosing the most reliable source for your needs.
_


