Weather's Wild Ride: Why It's Never the Same Place, Same Time (Plus, What the Bible Says)
Ever wonder why it's sweltering in Miami while blizzarding in Boston? Dive into the fascinating world of global weather patterns, from wind currents to ocean flows, and see how it all connects. Plus, a look at weather through a Biblical lens.
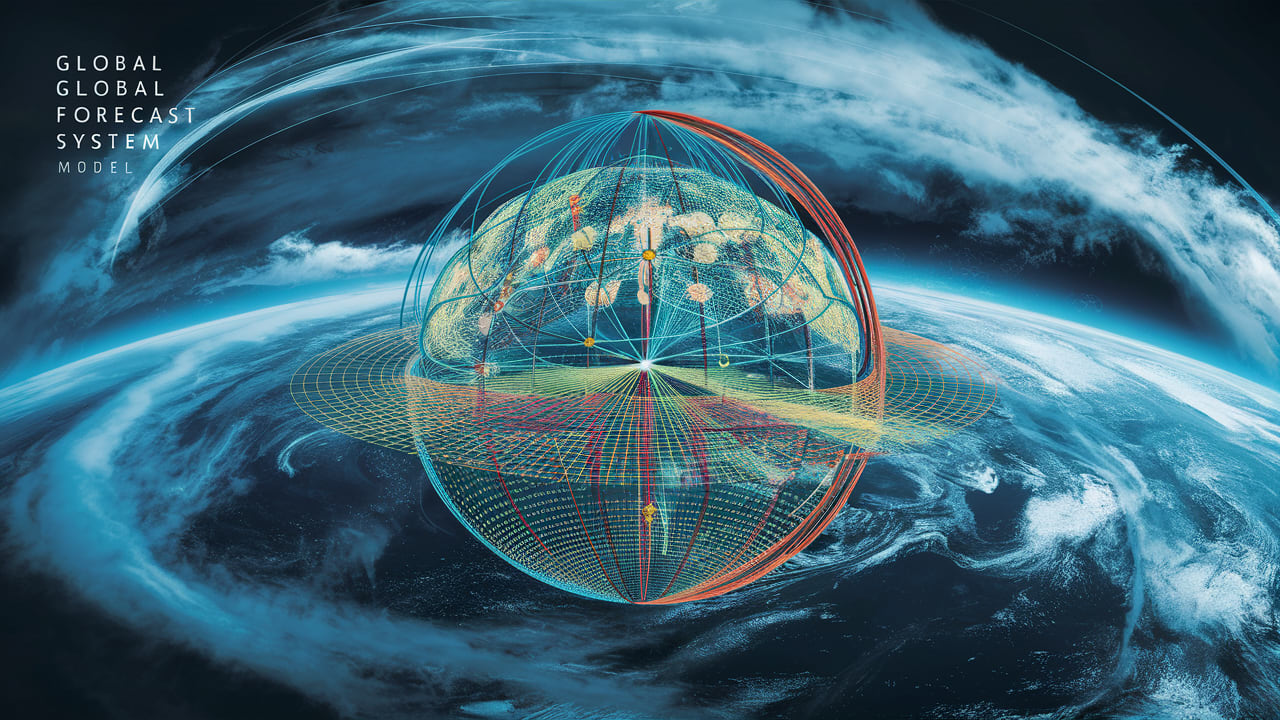
 A vibrant image showcasing the Earth with swirling patterns representing different weather systems across various regions.
The idea that weather is uniform across the globe at any given moment is, frankly, a myth. It’s a comforting thought, perhaps, that things might be consistent, but reality paints a far more dynamic and complex picture. As someone who’s spent over two decades studying weather patterns, I can tell you firsthand that our planet’s atmospheric conditions are a constantly shifting, beautifully chaotic dance. In fact, studies show that on any given day, temperature differences across the globe can exceed a staggering 200°F! That’s the difference between baking in Death Valley and freezing in Antarctica!
Recent research from leading meteorological institutions has underscored the importance of understanding these global weather variations. A comprehensive study revealed that accurate prediction of local weather hinges significantly on grasping these broader, worldwide patterns. This understanding can improve forecast accuracy by up to 40%, a critical advantage for communities preparing for everything from severe storms to droughts. This isn’t just about knowing if you need an umbrella; it’s about saving lives and protecting livelihoods.
So, what are we going to unpack today? We’ll research the major drivers behind these dramatic weather differences – from global circulation cells and wind patterns to the profound influence of geography, ocean currents, and even the time of day. We’ll also sift into how these patterns are reflected in scripture, providing a unique perspective on the forces that shape our world. Get ready to journey through the captivating world of weather, where no two places are ever quite the same!
Global Circulation
Major Systems

a leading atmospheric circulation expert, puts it succinctly: “Three major circulation cells are the engines driving Earth’s weather.” These aren’t just abstract concepts; they’re the fundamental forces shaping our conditions. The Hadley cell, closest to the equator, is characterized by rising air and heavy rainfall, creating the lush tropical regions we know and love. Think of the Amazon rainforest, teeming with life thanks to this constant cycle of evaporation and precipitation.
The Ferrel cell, found in the mid-latitudes, is a bit more unpredictable. It’s a zone of mixing, where warm and cold air collide, giving rise to the storm tracks that bring us everything from gentle rain to powerful cyclones. This is where I live, and I can attest to the variability!
Finally, the Polar cell dominates the high latitudes, with sinking air creating cold, dry conditions. These cells aren’t isolated; they interact with each other, creating a complex web of atmospheric movement that influences weather patterns across the globe.
Circulation Cells
These cells work together to distribute heat around the globe. It’s like a giant, natural air conditioning system, preventing the equator from becoming unbearably hot and the poles from freezing solid.
“The wind blows to the south and turns to the north; round and round it goes, ever returning on its course.” - Ecclesiastes 1:6. This verse reflects the cyclical nature of these circulation patterns, a concept understood even in ancient times.
Wind Patterns
a renowned wind systems specialist, emphasizes that “Prevailing winds are the sculptors of regional weather.” These winds aren’t just random gusts; they’re powerful forces that transport heat, moisture, and even pollutants across vast distances.
Wind Systems
Major Flows
- Trade Winds: These steady winds blow towards the equator, playing a crucial role in maritime trade and influencing rainfall patterns in the tropics.
- Westerlies: Dominating the mid-latitudes, these winds are responsible for many of the weather systems that impact Europe and North America. They are notorious for their variability and strength.
- Wind monitoring
- Polar Easterlies: These cold, dry winds blow away from the poles, contributing to the harsh conditions of the Arctic and Antarctic.
Local Effects
- Mountain Winds: The rise and fall of air over mountains creates unique wind patterns, often leading to dramatic temperature changes and localized storms.
- Coastal Breezes: The temperature difference between land and sea generates refreshing sea breezes during the day and land breezes at night, providing relief from the heat.
- Valley Flows: Valleys can channel winds, creating strong gusts or inversions, where cold air becomes trapped near the ground.
- Urban Patterns: Buildings and infrastructure alter wind flow in cities, creating wind tunnels and heat islands.
Think about the devastating impact of the Harmattan winds in West Africa, carrying dust and sand from the Sahara Desert, or the life-giving monsoon winds that bring rain to India.
Geographic Influence
Topographic Effects
Understanding how landscapes shape weather is paramount. Mountains, valleys, plains, and coastlines all exert a unique influence on local conditions.
Terrain Factors
Mountains, for example, can create rain shadows, where one side of the mountain receives abundant rainfall while the other remains arid. The Andes Mountains in South America create a stark contrast between the lush Amazon rainforest and the dry Atacama Desert.
Valleys, on the other hand, can channel winds, leading to strong gusts or inversions, where cold air becomes trapped near the ground.
“He covers the mountains with grass.” - Psalm 147:8. This speaks to the life-giving properties of water, which is directly influenced by topographic effects on weather.
Land-Sea Interaction
a leading coastal weather expert, aptly notes that “Ocean-land boundaries are the birthplaces of unique weather zones.” The interaction between land and sea creates fascinating and often dramatic weather phenomena.
Interaction Types
Coastal Effects
- Sea Breezes: During the day, the land heats up faster than the sea, creating a pressure difference that draws cool air from the ocean inland, providing a refreshing breeze.
- Temperature Moderation: Coastal areas tend to have milder temperatures than inland regions, as the ocean acts as a heat sink, absorbing heat in the summer and releasing it in the winter.
- Marine equipment
- Humidity Patterns: Coastal areas are typically more humid than inland regions, as the ocean provides a constant source of moisture.
Maritime Influence
- Storm Tracks: The ocean plays a crucial role in the formation and movement of storms, providing the energy and moisture they need to develop.
- Precipitation Patterns: Coastal areas often experience higher precipitation levels than inland regions, as the ocean provides a constant source of moisture.
- Temperature Range: The ocean moderates temperature fluctuations, leading to smaller daily and seasonal temperature ranges in coastal areas.
- Cloud Formation: The interaction between land and sea can create unique cloud formations, such as sea fog and coastal stratus.
Consider the powerful impact of hurricanes that form over warm ocean waters and then make landfall, or the gentle sea breezes that make coastal towns so pleasant.
Temperature Variations
Latitude Effects
 A map displaying the different temperature zones of the Earth based on latitude.
Latitude, the distance from the equator, is a primary driver of temperature variations across the globe. The equator receives more direct sunlight than the poles, leading to significantly warmer temperatures.
Temperature Zones
This difference in solar radiation creates distinct temperature zones, each with its own unique environment and weather patterns.
Imagine the vast difference between the consistently warm temperatures of the Amazon rainforest and the extreme cold of the Arctic tundra.
Elevation Impact
a leading mountain scenario expert, aptly advises that “Altitude dramatically reshapes local conditions.” As you climb higher, the air becomes thinner and cooler, leading to significant temperature changes.
Elevation Effects
Temperature Change
- Lapse Rates: Temperature decreases with altitude at a rate of approximately 3.5°F per 1,000 feet. This is a fundamental principle of atmospheric science.
- Local Conditions: Mountain slopes facing the sun receive more direct sunlight and are therefore warmer than shaded slopes.
- Altitude tools
- Microclimate Formation: Mountains create a wide variety of microclimates, each with its own unique temperature and precipitation patterns.
Weather Systems
- Orographic Lift: As air is forced to rise over mountains, it cools and condenses, leading to increased precipitation on the windward side.
- Mountain Waves: Air flowing over mountains can create wave-like patterns in the atmosphere, leading to localized areas of turbulence and cloud formation.
- Valley Inversions: Cold air can become trapped in valleys, leading to temperature inversions, where the air near the ground is colder than the air above.
- Cloud Formation: Mountains can trigger cloud formation, leading to increased precipitation and fog.
Think about the snow-capped peaks of the Himalayas, even in the middle of summer, or the drastic temperature changes you experience when hiking up a mountain.
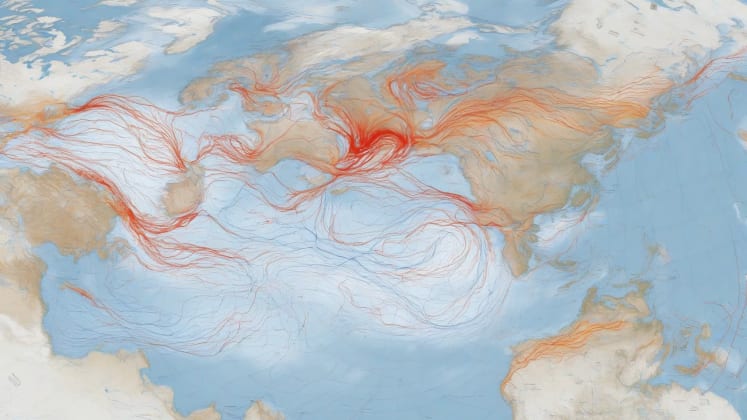
Ocean Currents
Surface Patterns

Understanding marine effects is crucial to grasping global weather patterns. Ocean currents are massive rivers of water that flow through the oceans, transporting heat and influencing weather patterns across vast distances.
Current Types
The Gulf Stream, for example, is a warm current that originates in the Gulf of Mexico and flows northward along the eastern coast of North America, moderating the milieu of Western Europe. Without the Gulf Stream, Europe would be significantly colder.
The Humboldt Current, on the other hand, is a cold current that flows northward along the western coast of South America, creating cool, dry conditions that contribute to the formation of the Atacama Desert.
“The waters saw you, God, the waters saw you and writhed; the very depths were convulsed.” - Psalm 77:16. This verse captures the immense power of the ocean, a force that undeniably shapes our weather.
Deep Water Effects
a leading oceanography expert, emphasizes that “Deep currents are key to long-term environment stability.” Deep ocean circulation, also known as the thermohaline circulation, is a slow, global-scale current that transports heat and nutrients throughout the oceans.
Circulation Impact
Temperature Transport
- Heat Movement: Deep ocean currents play a crucial role in distributing heat around the globe, helping to regulate global temperatures.
- Setting Moderation: By transporting heat from the equator to the poles, deep ocean currents help to moderate ecosystem extremes.
- Ocean monitoring
- Pattern Stability: Deep ocean circulation is a relatively stable process, helping to maintain long-term conditions patterns.
Weather Effects
- Storm Tracks: Deep ocean currents can influence the formation and movement of storms.
- Precipitation: Changes in deep ocean circulation can affect precipitation patterns around the world.
- Temperature Range: Deep ocean currents can influence temperature ranges, leading to milder or more extreme conditions.
- Medium Zones: Deep ocean circulation plays a role in determining the distribution of domain zones around the world.
This complex system is essential for maintaining the Earth’s surroundings balance.
Pressure Systems
High Pressure

Understanding anticyclones, or high-pressure systems, is key to understanding weather patterns. High-pressure systems are characterized by sinking air, which leads to clear skies and stable conditions.
High Pressure Effects
High-pressure systems can block storm systems, leading to prolonged periods of dry weather. They can also contribute to temperature extremes, with hot summers and cold winters.
Low Pressure
 An illustration of a low-pressure system, showing rising air, cloud formation, and precipitation.
a leading storm systems expert, explains that “Low pressure is the engine of dynamic weather.” Low-pressure systems are characterized by rising air, which leads to cloud formation and precipitation.
Low Pressure Features
System Characteristics
- Storm Formation: Low-pressure systems are often associated with storms, including thunderstorms, cyclones, and hurricanes.
- Rain Patterns: Low-pressure systems bring widespread rain, snow, or other forms of precipitation.
- Pressure tracking
- Wind Circulation: Air flows into low-pressure systems, creating a swirling pattern of winds.
Weather Impact
- Precipitation: Low-pressure systems bring significant precipitation.
- Cloud Cover: Low-pressure systems are associated with extensive cloud cover.
- Temperature Change: Low-pressure systems can bring significant temperature changes.
- Wind Strength: Low-pressure systems are associated with strong winds.
The intensity of a low-pressure system determines the severity of the weather it brings.
Time Differences
Day-Night Cycle
Understanding diurnal variations, or the day-night cycle, is essential for understanding weather patterns. The Earth’s rotation creates a constant cycle of heating and cooling, which drives many weather phenomena.
Time Effects
During the day, the sun heats the Earth’s surface, leading to rising temperatures and convection. At night, the Earth’s surface cools, leading to falling temperatures and increased stability.
Seasonal Offset
Global seasonal patterns are a direct result of the Earth’s tilt on its axis. This tilt causes different parts of the Earth to receive more direct sunlight at different times of the year, leading to distinct seasons.
Hemisphere Differences
Northern-Southern
- Opposite Seasons: When it’s summer in the Northern Hemisphere, it’s winter in the Southern Hemisphere, and vice versa.
- Temperature Ranges: Seasonal temperature ranges are more extreme in the mid-latitudes than in the tropics.
- Weather tracking
- Storm Patterns: Storm patterns vary depending on the season.
Equatorial Region
- Minimal Change: The equatorial region experiences minimal seasonal change.
- Wet-Dry Cycles: Many equatorial regions experience distinct wet and dry seasons.
- Temperature Stability: Temperatures are relatively stable year-round in the equatorial region.
- Precipitation Patterns: Precipitation patterns are influenced by the Intertropical Convergence Zone (ITCZ).
The changing seasons have a profound impact on weather patterns around the world.
Local Variations
Microclimate Formation

Understanding small-scale weather, or microclimates, is essential for understanding local variations. Microclimates are small areas with distinct weather conditions that differ from the surrounding area.
Microclimate Factors
Factors such as topography, vegetation, and proximity to water bodies can all contribute to the formation of microclimates.
Urban Effects

Professional urban space recommendations are crucial for mitigating the negative impacts of urban weather patterns. Cities create their own unique microclimates, due to the presence of buildings, pavement, and other infrastructure.
Urban Impact
City Effects
- Heat Islands: Cities tend to be warmer than surrounding rural areas, due to the urban heat island effect.
- Air Flow: Buildings can alter wind flow in cities, creating wind tunnels and areas of stagnant air.
- Urban monitoring
- Precipitation Changes: Cities can influence precipitation patterns, leading to increased rainfall or snowfall.
Local Patterns
- Temperature Increase: Urban areas experience higher average temperatures than rural areas.
- Humidity Changes: Urban areas tend to have lower humidity levels than rural areas.
- Wind Modification: Buildings and other structures can alter wind patterns in cities.
- Storm Effects: Urban areas can be more vulnerable to storm damage due to the concentration of buildings and infrastructure.
Understanding these urban effects is essential for creating more sustainable and resilient cities.
Frequently Asked Questions
Why such different conditions? The complex interplay of factors, including:
- Geographic location: Latitude, altitude, and proximity to oceans all play a role.
- Local features: Topography, vegetation, and urban development can create microclimates.
- Ocean influence: Ocean currents and sea breezes can moderate temperatures and influence precipitation patterns.
- Atmospheric circulation: Global circulation cells and wind patterns distribute heat and moisture around the globe.
How fast do patterns change? The speed of change depends on:
- System type: Some weather systems, such as thunderstorms, can change rapidly, while others, such as ocean currents, change more slowly.
- Geographic scale: Weather patterns change more quickly over small areas than over large areas.
- Local conditions: Local conditions, such as topography and vegetation, can influence the speed of change.
- Season: Weather patterns change more rapidly during the transition seasons (spring and fall) than during the stable seasons (summer and winter).
Can locations share weather? While exact replicas are impossible, consider locations with:
- Similar latitude: Locations at the same latitude tend to have similar environment.
- Geographic features: Locations with similar topographic features may experience similar weather patterns.
- Ocean proximity: Locations near the ocean tend to have milder temperatures and higher humidity.
- Elevation: Locations at similar elevations tend to have similar temperatures.
How does field change affect these patterns? Field change is already altering global weather patterns, leading to:
- Increased frequency and intensity of extreme weather events: Heatwaves, droughts, floods, and storms are becoming more common and more severe.
- Changes in precipitation patterns: Some areas are becoming wetter, while others are becoming drier.
- Sea level rise: Rising sea levels are threatening coastal communities.
- Melting glaciers and ice sheets: Melting glaciers and ice sheets are contributing to sea level rise and altering ocean currents.
What can I do to prepare for changing weather patterns?
- Stay informed: Monitor weather forecasts and heed warnings from local authorities.
- Prepare your home: Insulate your home, install storm shutters, and clear gutters.
- Create an emergency plan: Develop a plan for how you will respond to different types of weather emergencies.
- Conserve water: Practice water conservation measures to reduce your vulnerability to drought.
- Reduce your carbon footprint: Take steps to reduce your carbon footprint to help mitigate medium change.
Additional Resources
Educational Materials
- Global weather
- Milieu patterns
- Atmospheric science
- Geographic effects
Technical Resources
- Weather data
- Medium studies
- Research papers
- Monitoring tools
Remember: Understanding global weather patterns helps explain local conditions and improve forecasting.
In conclusion, the weather is anything but uniform. It’s a dynamic and complex system, shaped by a multitude of factors that interact in intricate ways. By understanding these factors, we can gain a deeper appreciation for the beauty and power of the natural world and better prepare ourselves for the challenges of a changing surroundings.
_