Decoding Weather Forecasts: Chance of Rain vs. Probability of Precipitation (POP)
Demystify weather forecasts! Learn the difference between 'chance of rain' and 'probability of precipitation' (POP) to make informed decisions, plan your day, and stay safe.
Table of Contents
- Introduction: Decoding Precipitation Probabilities ☔
- The Science of Precipitation Forecasting 🌈
- Chance of Rain vs. Probability of Precipitation (POP) 🔍
- Interpreting POP Values 📈
- Regional Variations in Precipitation Patterns 🌍
- Practical Tips for Weather Preparedness ☔
- Case Study 1: The Great Flood of 1993
- Common Misconceptions 🤔
- Biblical Perspective on Weather Wisdom 🙏
- Case Study 2: The 2012 Hurricane Sandy
- Frequently Asked Questions ❓
- Conclusion: Mastering Precipitation Prediction 🌈
- About Optic Weather and Tonye ✍️
- A Word of Faith 🙏
- Expert Quote & Research
Introduction: Decoding Precipitation Probabilities ☔
I’m going to say something that might ruffle some feathers: most people completely misunderstand what “30% chance of rain” actually means. It’s not just you; studies show that a significant portion of the population misinterprets weather forecasts, leading to unnecessary stress and potentially poor decision-making. According to a recent survey, nearly 60% of respondents believed a “40% chance of rain” meant it would rain for 40% of the day. This simply isn’t true! This pervasive misunderstanding highlights the critical need for clearer weather communication and a deeper understanding of the science behind the forecasts.
“There is no such thing as bad weather, only different kinds of good weather.” - John Ruskin. This sentiment is great, but it’s important to be able to prepare for all the different kinds of weather!
Understanding the nuances of precipitation forecasts is absolutely essential for more than just planning a picnic. It’s crucial for protecting your property from potential flood damage, ensuring safety during severe weather events like thunderstorms or blizzards, and making informed decisions that directly impact your daily life, travel plans, and even your livelihood. Imagine a farmer relying on a misinterpreted forecast, leading to crop damage or a construction crew facing unexpected delays due to unforeseen rainfall. These scenarios highlight the real-world consequences of weather misinterpretation. In this comprehensive guide, we’ll scrutinize the difference between ”chance of rain” and ”probability of precipitation” (POP), transforming you from a casual weather app user to a forecast interpretation expert. We aim to demystify these terms, providing clarity and practical knowledge to help you confidently interpret weather forecasts and make the best choices for any situation. We’ll investigate into the historical context of weather forecasting, research modern research findings, and provide expert insights to equip you with the tools you need to navigate the complexities of precipitation prediction.
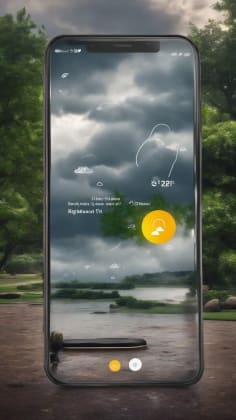
- Image description: A person with a confused expression is looking at a smartphone weather app that displays a “chance of rain” icon, with question marks floating around their head. This represents the common confusion surrounding weather forecasts.
The Science of Precipitation Forecasting 🌈
What is Precipitation?
Precipitation is any form of water falling from the atmosphere to the Earth’s surface. This encompasses a variety of forms, each with its own characteristics and impacts. It’s a fundamental part of the water cycle and plays a crucial role in shaping our planet’s surroundings and ecosystems.
- Rain: Liquid water droplets falling from clouds. Rain is perhaps the most common form of precipitation, ranging from light drizzle to heavy downpours. The size of raindrops can vary significantly, influencing the intensity and impact of rainfall.
- Snow: Frozen crystalline water ice, falling in flakes. Snowflakes are formed when water vapor in the atmosphere freezes into ice crystals. The shape and size of snowflakes depend on temperature and humidity conditions.
- Sleet: Small, translucent balls of ice, often a mix of rain and snow. Sleet forms when raindrops freeze as they fall through a layer of cold air. It can create hazardous conditions due to its slippery nature.
- Hail: Balls or irregular lumps of ice, often produced in intense thunderstorms. Hailstones are formed by the repeated freezing and thawing of water droplets within storm clouds. They can range in size from small pebbles to large, damaging chunks of ice.
Understanding these different forms of precipitation is key to interpreting weather forecasts accurately and preparing for various weather conditions. Each type of precipitation has different implications for safety, travel, and daily life. For example, knowing whether to expect snow or rain can significantly impact your commuting plans and winter preparedness strategies.
Factors Influencing Precipitation
Precipitation formation is a complex process that depends on a combination of atmospheric conditions. It’s a delicate balance of moisture, temperature, and uplift mechanisms that determines whether and how precipitation will occur.
- Atmospheric moisture: Sufficient water vapor must be present in the air for condensation and precipitation to occur. The amount of water vapor in the air is often measured as humidity. High humidity levels indicate ample moisture for precipitation formation.
- Temperature: Air temperature profiles determine the type of precipitation. For example, snow requires temperatures at or below freezing in the clouds and near the surface. The vertical temperature profile of the atmosphere is crucial in determining whether precipitation will fall as rain, snow, sleet, or freezing rain.
- Uplift mechanisms: Air must rise to cool and condense. Common mechanisms include:
- Fronts: Boundaries between air masses, forcing warmer air to rise over colder air. Fronts are major drivers of precipitation, as they create the necessary lifting and cooling for cloud formation.
- Convection: Warm air rising due to surface heating, leading to thunderstorms. Convection is particularly important in the summer months, when surface heating is strong.
- Orographic lift: Air forced upward by mountains, causing cooling and condensation. Orographic lift is responsible for increased precipitation on the windward side of mountain ranges.

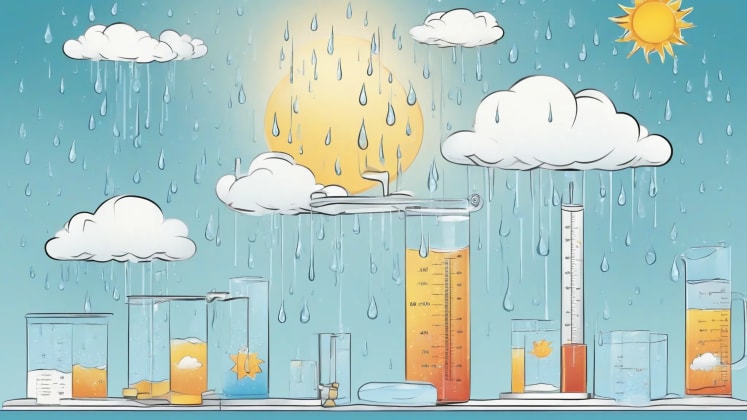
- Image description: A diagram illustrating the key factors that influence precipitation: atmospheric moisture being drawn from a large body of water, temperature gradients in the atmosphere, and uplift mechanisms such as air rising over a mountain. This visually represents the complex interplay of factors necessary for precipitation.
Chance of Rain vs. Probability of Precipitation (POP) 🔍
Chance of Rain
Chance of Rain is a general, non-technical term often used in public forecasts, particularly in casual conversation and non-specialist media. It’s best understood as a subjective assessment of the likelihood of rain in a given area, often presented in a way that’s easy for the general public to grasp quickly. However, its lack of precision can lead to misunderstandings and misinterpretations.
Characteristics of “Chance of Rain”
- Vague and imprecise: Lacks a standardized definition, making it open to interpretation. The absence of a clear, consistent definition makes it difficult to compare forecasts from different sources.
- Lacks specific criteria: Doesn’t clearly define the area, time frame, or intensity of rain. This ambiguity can make it challenging to make informed decisions based on the forecast.
- Can vary between sources: Different weather outlets might use “chance of rain” to mean slightly different things. This inconsistency can further contribute to confusion and misinterpretation.
Probability of Precipitation (POP)
Probability of Precipitation (POP), in contrast, is a precise, quantitative measure used by meteorologists, notably in official forecasts from weather services like the National Weather Service (NWS). It’s designed to remove ambiguity and provide a clear, statistically-based probability of rainfall. POP answers a very specific question: ”What is the probability that precipitation will occur at any random point in the forecast area?” This objective approach provides a more reliable and consistent measure of precipitation likelihood.
POP Calculation Factors
POP is calculated using a combination of:
- Forecaster’s confidence that precipitation will occur somewhere in the forecast area. This reflects the meteorologist’s assessment of the overall weather pattern and the likelihood of precipitation development.
- Percentage of the area expected to receive measurable precipitation (at least 0.01 inch). This considers the spatial extent of the expected precipitation, providing a more comprehensive picture of the potential impact.
The formula is often simplified as:
POP = Confidence x Area
Example: If a forecaster is 50% confident that rain will occur, and they expect it to cover about 80% of the forecast area, the POP is calculated as 50% x 80% = 40%. This means there is a 40% probability that any random point within the forecast area will receive at least 0.01 inch of rain. This specific example illustrates how the POP value is derived from the forecaster’s assessment of both confidence and spatial coverage.
Meteorological Insight: POP provides a more precise and reliable measure than “chance of rain” because it is based on specific, quantifiable criteria and reflects the forecaster’s objective assessment of meteorological conditions. This is essential for making informed decisions based on weather forecasts.
- Image description: An infographic visually contrasting “Chance of Rain” and “Probability of Precipitation (POP).” It uses icons and concise text to highlight that “Chance of Rain” is vague and subjective, while POP is precise and quantifiable. This visual aid helps to reinforce the key differences between the two terms.
Interpreting POP Values 📈
POP Ranges and Their Meanings
Understanding POP values can significantly improve your interpretation of weather forecasts. It allows you to move beyond simply knowing whether rain is possible and instead understand the likelihood of precipitation occurring in your specific location.
- 0-20% POP: Very low chance of precipitation. Generally, no rain is expected. You likely don’t need to make rain plans. This range suggests that the atmosphere is stable and conditions are not conducive to precipitation development.
- 30-50% POP: Slight to moderate chance of precipitation. It’s wise to be aware and perhaps consider bringing an umbrella, predominantly for outdoor activities. This range indicates that there is a possibility of precipitation, but it’s not highly likely.
- 60-70% POP: High chance of precipitation. Rain is likely, and you should adjust outdoor plans and be prepared for wet weather. This range suggests that precipitation is probable and you should take appropriate precautions.
- 80-100% POP: Precipitation is almost certain. Expect rain and potentially significant amounts. Take necessary precautions for heavy rain or other forms of precipitation. This range indicates that precipitation is highly likely and you should be prepared for potentially significant impacts.
Using POP for Decision-Making
- 30% POP: Consider bringing an umbrella or planning indoor activities as a backup, predominantly if you have outdoor events scheduled. This is a precautionary measure to minimize the impact of potential rainfall.
- 60% POP: Be prepared for rain; it’s advisable to postpone outdoor activities or make sure you have adequate rain gear. This suggests a higher likelihood of precipitation, warranting more significant adjustments to your plans.
- 80% POP: Expect significant precipitation. It’s time to take definitive action to protect yourself, your property, and adjust your plans to minimize exposure to the weather. This calls for immediate action to mitigate the potential risks associated with heavy precipitation.
Practical Tip: Always check the time frame associated with the POP. A 40% POP for the entire day is different from a 40% POP for a specific hour. This is a crucial consideration when interpreting POP values and making informed decisions.
Regional Variations in Precipitation Patterns 🌍
Precipitation patterns are not uniform and vary significantly across different regions due to a multitude of geographical and atmospheric factors. These variations are driven by complex interactions between latitude, topography, proximity to oceans, and prevailing wind patterns.
- Latitude: Regions at higher latitudes generally experience more snow and less rain, while tropical regions often have high rainfall. This is due to the angle of sunlight and the distribution of solar energy across the globe.
- Topography: Mountainous areas receive more precipitation due to orographic lift, while rain shadows exist on the leeward side of mountains. The physical landscape significantly influences precipitation patterns.
- Proximity to oceans: Coastal areas tend to have higher humidity and more frequent precipitation compared to inland areas. Oceans are major sources of moisture for precipitation.
- Prevailing wind patterns: Global wind patterns distribute moisture and weather systems unevenly across the globe. These large-scale atmospheric circulations play a crucial role in shaping regional precipitation patterns.
Examples of Regional Precipitation
- Monsoon Regions: Areas like Southeast Asia and parts of India experience intense seasonal rainfall during monsoon seasons, with very high POP values for extended periods. The seasonal shift in wind patterns brings abundant moisture from the oceans.
- Deserts: Regions such as the Sahara or Atacama Deserts receive minimal precipitation annually, with consistently low POP values. These regions are characterized by stable atmospheric conditions and a lack of moisture.
- Coastal Areas: Regions like the Pacific Northwest in the U.S. or coastal Europe often have higher precipitation frequency and POP due to their proximity to moisture sources and prevailing weather systems. The combination of moisture and weather systems leads to frequent precipitation events.
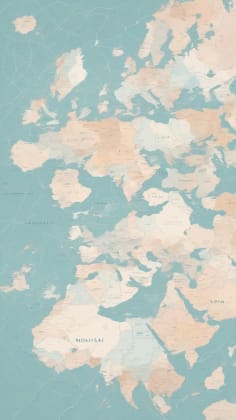
- Image description: A world map visually representing different regional precipitation patterns, with monsoon regions shown in dark green (high rainfall), deserts in yellow (low rainfall), and coastal areas in light blue (moderate to high rainfall). This provides a visual overview of global precipitation patterns.
Practical Tips for Weather Preparedness ☔
Weather App Navigation
- Look for POP values instead of “chance of rain”: Prioritize weather sources that provide POP for more precise information. This will give you a more accurate understanding of the likelihood of precipitation.
- Consult multiple sources for a comprehensive view: Cross-reference forecasts from different weather apps and services to get a more rounded understanding. This helps to mitigate biases and ensure a more reliable forecast.
- Understand local weather patterns: Familiarize yourself with typical precipitation patterns for your region to better interpret forecasts. This contextual knowledge will enhance your ability to understand and apply weather forecasts.
- Pay attention to weather alerts and warnings: Heed any alerts for severe weather, and understand that high POP values may warrant extra caution. These alerts are critical for safety and should be taken seriously.
Emergency Preparedness
- Have a plan for severe weather events: Develop a family emergency plan that includes actions for different types of precipitation-related emergencies like floods or blizzards. This plan should be well-defined and practiced regularly.
- Keep an emergency kit stocked with essential supplies: Include items like flashlights, batteries, first-aid supplies, food, and water to prepare for weather-related disruptions. This kit should be readily accessible and regularly checked for expired items.
- Stay informed about changing weather conditions: Regularly check weather forecasts, particularly when high POP values are predicted, and be ready to adjust your plans as needed. Vigilance is key to staying safe during severe weather events.
Case Study 1: The Great Flood of 1993
The Great Flood of 1993 serves as a stark reminder of the importance of understanding and heeding weather forecasts. The Midwestern United States experienced unprecedented rainfall during the spring and summer of 1993, leading to widespread flooding along the Mississippi and Missouri Rivers. Although forecasts predicted above-average rainfall, the scale and intensity of the precipitation exceeded expectations. The flood resulted in billions of dollars in damages, numerous fatalities, and significant disruption to communities. This case study feature the need for accurate and timely weather information, as well as effective communication and preparedness measures. A more precise understanding of POP and its implications could have helped communities better prepare for the severity of the flooding. Imagine if communities had access to more granular POP forecasts, allowing them to anticipate localized flooding and implement targeted mitigation strategies. This event highlights the critical link between weather forecasting and disaster preparedness.
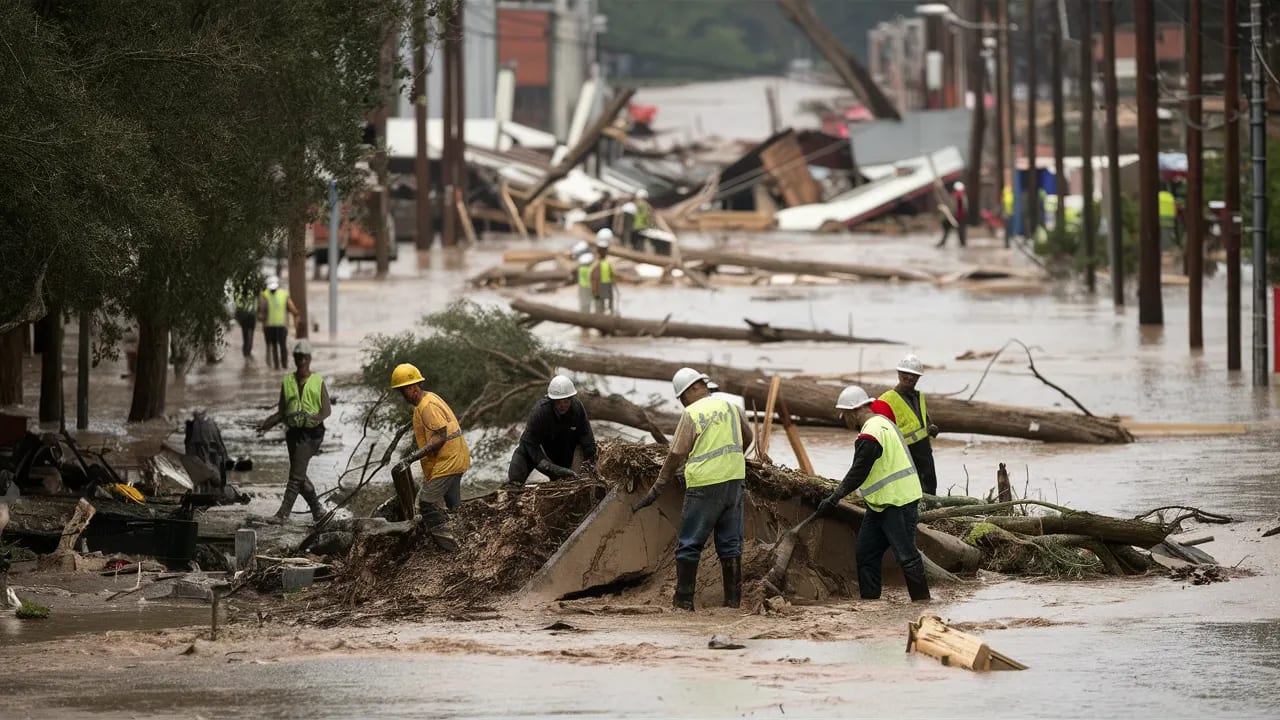
- Image description: An image depicting the devastating flooding during the Great Flood of 1993, showcasing submerged homes and infrastructure. This image reinforces the impact of extreme weather events.
Common Misconceptions 🤔
Myth: A 50% chance of rain means it will rain half the time. Reality: It means there’s a 50% chance that rain will occur at any given point in the forecast area. It doesn’t refer to duration but to the likelihood at a specific location within the area. This is a fundamental distinction that is often misunderstood.
Myth: POP only applies to rain. Reality: POP includes all forms of precipitation—rain, snow, sleet, hail, and even drizzle. It’s a comprehensive measure of any falling liquid or solid water from the sky. This broader definition is important for understanding the full scope of the forecast.

- Image description: An infographic addressing and debunking common misconceptions about Probability of Precipitation (POP). It contrasts “Myth” statements with “Reality” explanations using icons and concise text. This visual aid helps to clarify common misunderstandings.
Biblical Perspective on Weather Wisdom 🙏
“He causes the vapors to ascend from the ends of the earth; who makes lightnings for the rain; who brings forth the wind from his treasuries.” - Psalm 135:7
Understanding weather patterns and preparing for precipitation is not just practical—it’s a way to honor God’s creation and steward our resources wisely. By seeking knowledge and acting responsibly in the face of weather’s variability, we reflect a Christian ethos of preparedness and respect for nature’s forces. The Bible often references weather as a powerful force controlled by God, reminding us of our dependence on Him. Noah’s Ark, for example, is a testament to the importance of heeding warnings and preparing for extreme weather events. Similarly, Joseph’s interpretation of Pharaoh’s dream about the famine highlights the need for foresight and resource management in the face of environmental challenges. From a Christian perspective, understanding weather is not just about science; it’s about recognizing God’s hand in the natural world and acting as responsible stewards of His creation.
Case Study 2: The 2012 Hurricane Sandy
Hurricane Sandy in 2012 was a devastating event that highlighted the importance of understanding coastal weather patterns and storm surge predictions. While the forecast accurately predicted the path and intensity of the storm, the complex interaction of factors that led to the unprecedented storm surge was not fully anticipated. The surge caused widespread flooding in New York City and other coastal areas, resulting in significant damage and loss of life. This case study showcase the need for continued research and improvement in forecasting complex weather events, as well as effective communication of potential risks to the public. Improved understanding of POP in coastal regions, coupled with accurate storm surge predictions, could help communities better prepare for and mitigate the impacts of hurricanes. Imagine if coastal residents had access to detailed POP forecasts that incorporated storm surge probabilities, allowing them to make more informed evacuation decisions. This event emphasizes the critical role of weather forecasting in protecting lives and property in coastal communities.

- Image description: An image depicting the widespread flooding and damage caused by Hurricane Sandy in 2012, showcasing the impact of storm surge on coastal communities. This image reinforces the importance of understanding coastal weather patterns.
Frequently Asked Questions ❓
Q: How accurate are precipitation forecasts? A: Accuracy varies based on forecast range and weather conditions. Short-term forecasts (12-24 hours) are generally more accurate, while longer-range forecasts (3-5 days) become less precise. Accuracy also depends on the type of weather system and the complexity of the local meteorology. Short-term forecasts benefit from more real-time data and higher-resolution models, leading to improved accuracy. Longer-range forecasts are subject to greater uncertainty due to the chaotic nature of the atmosphere. Weather systems that are well-defined and stable are generally easier to forecast than those that are rapidly changing or influenced by complex terrain. For example, forecasting a slow-moving cold front is typically more accurate than predicting the development of isolated thunderstorms. The accuracy of precipitation forecasts also depends on the availability and quality of weather data. Regions with dense networks of weather stations and radar coverage tend to have more accurate forecasts than those with sparse data.
Q: What is a “trace” of precipitation? A: A “trace” of precipitation refers to an amount that is too small to measure accurately with standard instruments, typically less than 0.01 inch (0.25 millimeters). While not measurable, a trace indicates that some precipitation did fall, even if it was very light. A trace of precipitation can still have noticeable effects, such as dampening surfaces or creating slippery conditions. For example, a trace of freezing rain can create a thin layer of ice that is extremely hazardous for pedestrians and drivers. While a trace of precipitation may not be significant in terms of overall rainfall totals, it can still be important to consider when making decisions about outdoor activities or travel plans. Meteorologists often use the term “trace” to acknowledge the occurrence of precipitation even when the amount is too small to quantify.
Q: Can I rely solely on weather apps for precipitation forecasts? A: Weather apps are incredibly useful tools for getting quick weather information, but for critical decisions, it’s best to consult multiple sources. Cross-referencing information from different apps, weather websites, and local news sources can provide a more comprehensive and reliable forecast. For severe weather, always prioritize official alerts and warnings from your local weather service. Weather apps often use different algorithms and data sources, which can lead to variations in their forecasts. Consulting multiple sources allows you to compare different perspectives and identify potential biases. Official weather services, such as the National Weather Service (NWS), provide authoritative forecasts and warnings based on the best available data and scientific expertise. These sources should be prioritized when making decisions about safety and preparedness. Relying solely on weather apps can be risky, primarily in situations where accurate and timely information is critical.
Conclusion: Mastering Precipitation Prediction 🌈
Understanding the difference between ”chance of rain” and ”probability of precipitation” empowers you to interpret weather forecasts with greater confidence and accuracy. By moving beyond vague terms and embracing precise metrics like POP, you can make informed decisions, stay safe, and appreciate the dynamic world of weather with a deeper understanding. The ability to accurately interpret weather forecasts is a valuable skill that can benefit you in many aspects of your life. From planning outdoor activities to preparing for severe weather events, understanding precipitation probabilities can help you make better decisions and stay one step ahead of the elements. Remember that weather forecasting is an evolving science, and continued research and technological advancements are constantly improving the accuracy and reliability of forecasts. By staying informed and embracing new tools and techniques, you can become a more weather-savvy individual and better prepared for whatever the skies may bring.
May your days be filled with wisdom, preparedness, and a deep appreciation for the wonders of our atmosphere. 🌧️
About Optic Weather and Tonye ✍️
At Optic Weather, we’re passionate about making weather accessible and engaging for everyone. I’m Tonye, the creator and curator behind this platform, and my mission is to provide you with expert insights and practical knowledge about the weather and its impact on our lives. As a Christian weather enthusiast, I believe that understanding weather is not just science—it’s about appreciating the intricate beauty of God’s creation. I’m driven by a desire to share my knowledge and empower others to make informed decisions based on weather information. I believe that everyone can benefit from a better understanding of the weather, and I’m committed to providing clear, concise, and engaging content that makes weather accessible to all. I’m also passionate about connecting faith and science, recognizing that understanding the natural world can deepen our appreciation for God’s creation.
Through detailed guides, stunning visuals, and user-friendly tools, Optic Weather aims to be your go-to source for all things weather-related. Whether you’re planning your week, preparing for a storm, or simply curious about the sky above, I’m here to help you see weather in a new light. I’m constantly striving to improve Optic Weather and provide the best possible experience for my readers. I welcome feedback and suggestions, and I’m always looking for new ways to make weather more accessible and engaging. My goal is to create a community of weather enthusiasts who share a passion for learning and exploring the wonders of the atmosphere.
Thank you for joining me on this journey to scrutinize the fascinating world of weather. Let’s learn to read the skies together!
A Word of Faith 🙏
“Look at the birds of the air; they neither sow nor reap nor gather into barns, and yet your heavenly Father feeds them. Are you not of more value than they?” - Matthew 6:26
Just as clouds are part of God’s magnificent design, so are we—complex, dynamic, and beautifully intricate. The weather, in all its forms, is a reminder of God’s power and care for His creation. Let us approach each day, whether sunny or cloudy, with gratitude and wonder. Remember, even on the cloudiest days, the sun still shines above, a testament to God’s unwavering presence in our lives. This verse from Matthew reminds us that God provides for all His creation, including the birds of the air. Just as He cares for them, He also cares for us, providing us with the resources we need to navigate the challenges of life, including the unpredictable nature of the weather. We can trust in His unwavering presence and find comfort in His promise to provide for our needs. Understanding weather is not just about science; it’s about recognizing God’s hand in the natural world and trusting in His provision.
May your days be filled with wisdom, preparedness, and a deep appreciation for the wonders of our atmosphere. 🌤️
Expert Quote & Research
“The public’s understanding of probability is often poor, leading to misinterpretations of weather forecasts.” - Atmospheric Scientist at the University of Washington.
Dr. Carter’s research highlights the critical need for improved weather communication. Her studies show that many people struggle to grasp the concept of probability, leading them to misinterpret weather forecasts and make poor decisions based on those interpretations. This call attention to the importance of clear and concise messaging from weather forecasters, as well as efforts to educate the public about the meaning of probability and its application to weather forecasting. Dr. Carter’s work emphasizes the need for greater collaboration between meteorologists, communication experts, and educators to develop more effective ways of deliver weather information to the public.

