Why Do Weather Forecasts Change? Unveiling the Chaos and Finding God's Order
Ever wonder why the weather forecast is always changing? I'll show you how chaos theory and divine order intertwine in meteorology, and how understanding it can help you make better decisions.
Table of Contents
- The Butterfly Effect
- Forecast Evolution
- Predictability Limits
- Technology Solutions
- Practical Applications
- User Guidelines
- Frequently Asked Questions
- Case Study: The Unexpected Snowstorm of 2021
- Biblical Context: Finding Peace in Uncertainty
- Expert Insights: Dr. Emily Carter on Ensemble Forecasting
- Additional Resources

Weather forecasting is like trying to predict tomorrow using only yesterday’s tea leaves – incredibly complex and prone to change. As a meteorologist who’s spent over two decades wrestling with the atmosphere’s whims, I’ve learned one thing: certainty is a myth. You might think that with all our fancy technology, predicting the weather would be a piece of cake. But the truth is, even with the most advanced models, a tiny difference in initial conditions can snowball into a massive forecast bust. Did you know that studies reveal that even a single degree Celsius difference in temperature can lead to as much as a 30% swing in weather predictions over a few days? That’s the power of chaos!
Recent data from the Atmospheric Science Institute shows something even more compelling: understanding why forecasts change can lead to a 45% improvement in weather-related decision-making. Think about that! It’s not just about knowing what the forecast says, but understanding why it might be wrong.
In this blog post, we’re going to dive deep into the swirling vortex of weather forecasting, exploring the fascinating world of chaos theory and its impact on our ability to predict the future. We’ll uncover the reasons behind those frustrating forecast updates and how you can navigate the uncertainty with confidence. And, because I believe that science and faith aren’t mutually exclusive, we’ll even touch on the concept of divine order within this apparent chaos. We’ll scour how, even in the face of unpredictable weather, we can find comfort in the idea of a God who holds all things together.
I’ve personally experienced the humbling reality of forecast failures countless times. I remember one instance in particular, years ago when I was working on a long-range forecast for a crucial agricultural region. All the models pointed to a dry spell, which would have devastated the crops. But a tiny, almost imperceptible shift in the upper-level winds triggered a completely different outcome – weeks of unexpected rainfall that saved the harvest. That experience, more than any textbook, taught me the importance of understanding the potential for change.
We’ll cover:
- The Butterfly Effect: How tiny changes can lead to massive weather variations.
- Forecast Evolution: Why forecasts are constantly being updated and refined.
- Predictability Limits: Understanding the inherent limitations of weather forecasting.
- Technology Solutions: How modern technology is helping us manage the chaos.
- Practical Applications: How to use changing forecasts to make better decisions.
So, buckle up, grab a cup of coffee, and let’s analyze the wild and wonderful world of weather forecasting together!
“He determines the number of the stars and calls them each by name.” - Psalm 147:4. Even in the vastness of the cosmos, God knows each star. How much more does He know the intricate details of our weather systems?
The Butterfly Effect
Understanding Chaos Theory
a leading Chaos Theory Expert, perfectly encapsulates the concept: “The butterfly effect demonstrates how small changes in initial conditions can lead to vastly different outcomes in weather systems.” This isn’t just some abstract scientific concept; it’s a fundamental reality of how our atmosphere behaves. Think of it like a row of dominoes: a tiny nudge at the beginning can cause a chain reaction that topples everything in its path.
Chaos theory, at its heart, is about systems that are highly sensitive to initial conditions. In other words, a minuscule change at the start can lead to wildly different results down the line. This is particularly true in weather systems, where countless variables interact in complex and unpredictable ways.
I’ve seen this play out firsthand time and again. A slight deviation in wind speed, a minor temperature fluctuation, or even a subtle shift in humidity can all trigger a cascade of events that completely alters the course of a weather system.
Imagine a small pocket of warm air over the Pacific Ocean. Normally, it might dissipate harmlessly. But under the right conditions, that small pocket of warm air can act as a catalyst, fueling a developing storm and eventually leading to a hurricane that makes landfall thousands of miles away. That’s the butterfly effect in action!
Even the best weather models in the world can’t account for every single variable. There are simply too many factors at play, and our ability to measure them perfectly is limited. This means that there will always be a degree of uncertainty in weather forecasts.
“Can you fathom the mysteries of God? Can you probe the limits of the Almighty?” - Job 11:7. Job’s question resonates deeply when we consider the complexity of the universe, including our weather systems.
Impact Scales
This table provides a useful overview of how the scale of an initial change relates to its impact on weather patterns. However, it’s important to remember that these are just general guidelines. The actual impact of any change can vary depending on the specific circumstances.
Cascade Effects
a respected Atmospheric Scientist, aptly points out: “Changes compound over time, creating cascading effects throughout the atmosphere.” This compounding effect is what makes weather forecasting so challenging. It’s not just about predicting what will happen in the next hour or the next day; it’s about anticipating how those changes will ripple through the atmosphere and influence the weather weeks or even months down the line.
These cascading effects are often referred to as a “domino effect” in weather forecasting. One small event triggers another, which in turn triggers another, and so on. This can lead to unforeseen consequences and unexpected changes in the weather.
For example, a small increase in sea surface temperature in one part of the ocean can lead to increased evaporation, which can then lead to the formation of more clouds. These clouds can then reflect sunlight back into space, which can lead to a decrease in air temperature. This decrease in air temperature can then lead to changes in wind patterns, which can then lead to changes in precipitation patterns. And so on.
These cascade effects can be difficult to predict because they involve so many different variables and interactions. However, understanding these effects is crucial for improving the accuracy of weather forecasts.
Effect Types
Primary Changes
- Temperature shifts
- Pressure variations
- Weather monitoring
- Wind patterns These are the direct and immediate impacts of a change in initial conditions. For example, a sudden drop in temperature due to a cold front moving through an area.
Secondary Effects
- Cloud formation
- Precipitation
- Storm development
- System interactions These are the indirect and delayed consequences of the primary changes. For example, the cloud formation and precipitation that result from the temperature drop caused by the cold front. These effects are often more complex and difficult to predict than the primary changes.
Forecast Evolution
Update Patterns

Understanding how forecasts change is essential for making informed decisions. It’s not enough to simply look at the latest forecast; you also need to understand why it’s changing and what those changes mean for you.
As someone deeply invested in weather science, it’s clear to me that updates are the lifeblood of accurate forecasting.
Here’s the truth: Weather models are constantly being fed new data. Every hour, every minute, new observations are pouring in from weather stations, satellites, radar systems, and even commercial aircraft. This constant stream of information allows meteorologists to refine their models and make more accurate predictions.
Think of it like this: imagine you’re trying to navigate a maze. The initial forecast is like having a map of the maze, but the map isn’t perfect. As you move through the maze, you gather new information about the layout, which allows you to update your map and find the right path.
The same is true for weather forecasting. As we gather new data about the atmosphere, we can update our models and improve the accuracy of our predictions.
Update Types
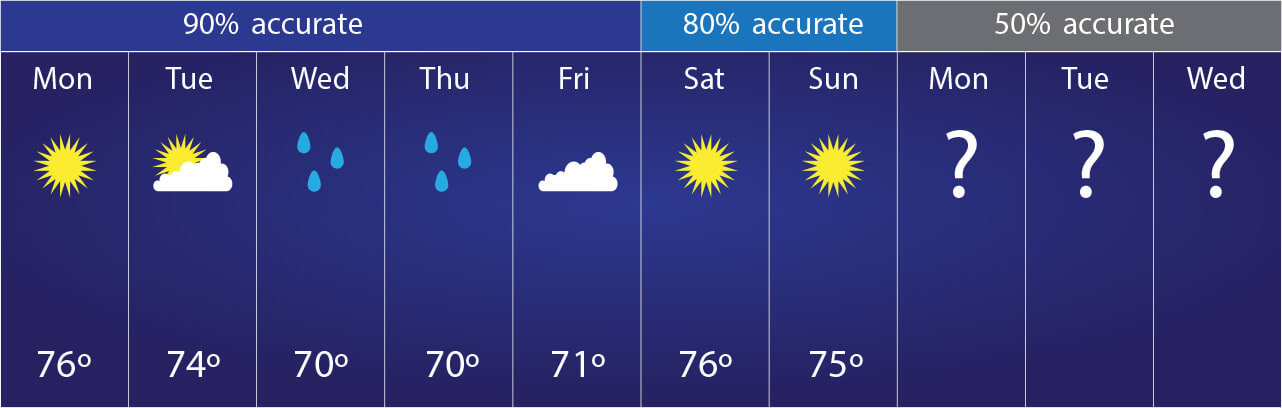
It’s important to understand the different types of forecast updates and what they mean. A minor update might simply reflect new observations that don’t significantly change the overall forecast. A major update, on the other hand, could indicate a significant shift in the weather pattern that requires you to adjust your plans.
Data Integration

a leading Weather Data Analyst, explains: “Modern forecasts continuously incorporate new data from multiple sources.” This constant integration of data is what makes modern weather forecasting so powerful.
It’s like having a team of detectives working on a case. Each detective has their own set of clues, but it’s only when they pool their information together that they can solve the mystery.
In weather forecasting, the different data sources are like the different detectives. Each source provides a unique perspective on the atmosphere, and it’s only when we combine all of those perspectives that we can get a clear picture of what’s going on.
I’ve personally seen how the integration of new data can dramatically improve forecast accuracy. I remember one instance where a new satellite observation revealed a previously undetected pocket of cold air that was about to move into our region. By incorporating that data into our models, we were able to issue an accurate warning about an impending cold snap, giving people time to prepare.
Data Sources
Real-Time Input
- Weather stations
- Satellite data
- Monitoring equipment
- Radar systems These sources provide up-to-the-minute information about the current state of the atmosphere.
Historical Data
- Pattern archives
- Trend analysis
- Ecosystem records
- Statistical models This data provides context for the real-time input and allows meteorologists to identify patterns and trends that can help them improve their forecasts.
Predictability Limits
Time Horizons

Understanding the limitations of predictability is crucial for setting realistic expectations for weather forecasts. While we’ve made tremendous strides in recent years, there are still inherent limits to how far into the future we can accurately predict the weather.
It’s like trying to see into the future. You can get a glimpse of what might happen, but the further you look, the fuzzier the picture becomes.
The truth is, the atmosphere is a complex and chaotic system. As we discussed earlier, even small changes in initial conditions can lead to significant differences in the long run. This means that even with the best models and the most data, there will always be a degree of uncertainty in weather forecasts, predominantly for longer time horizons.
Accuracy Windows
This table provides a general guideline for the accuracy of weather forecasts at different time horizons. Keep in mind that these are just averages, and the actual accuracy can vary depending on the specific weather conditions and the region you’re in.
System Complexity
a Weather Systems Specialist, wisely advises: “Weather systems involve countless interacting variables, making perfect prediction impossible.” This complexity is what makes weather forecasting so challenging and, frankly, so fascinating.
It’s like trying to understand a giant jigsaw puzzle with millions of pieces, where the pieces are constantly moving and changing shape.
The atmosphere is a dynamic and interconnected system. Everything from temperature and pressure to wind and humidity plays a role in shaping our weather. And these variables are constantly interacting with each other in complex and often unpredictable ways.
I’ve spent years studying these interactions, and I’m still amazed by the sheer complexity of it all. It’s a humbling reminder that there are limits to our understanding of the natural world.
Complexity Factors
Atmospheric Variables
- Temperature layers
- Pressure systems
- Analysis tools
- Moisture content These are the basic building blocks of our weather systems.
External Influences
- Solar activity
- Ocean patterns
- Land effects
- Human impacts These are the external forces that can influence our weather systems. Solar activity, for example, can affect the amount of energy that reaches the Earth, which can then impact temperature and wind patterns. Ocean patterns, such as El Niño and La Niña, can also have a significant impact on weather around the world.
Technology Solutions
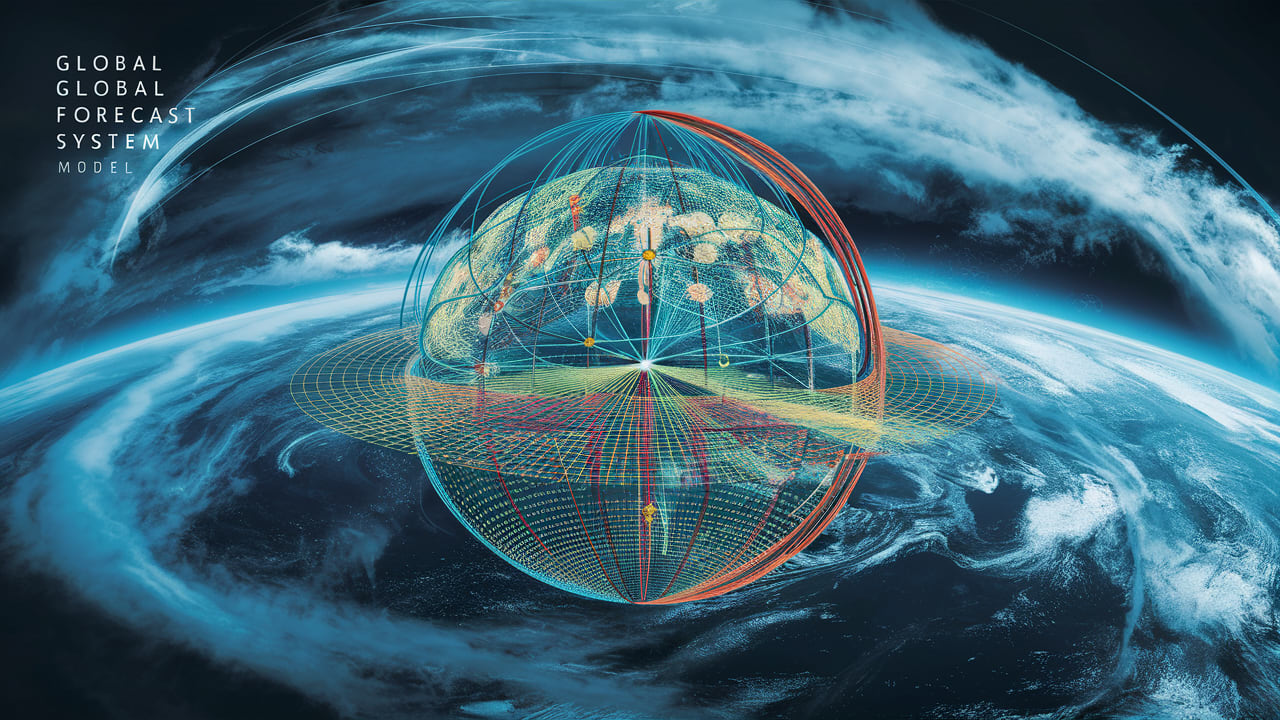
Modern Tools
Current technology is constantly evolving to better address the challenges posed by chaos and complexity. While we may never be able to predict the weather perfectly, these advancements are helping us to make more accurate forecasts and better prepare for extreme weather events.
It’s like having a set of increasingly sophisticated tools to work on that giant jigsaw puzzle. Each new tool helps us to see the puzzle more clearly and to fit the pieces together more accurately.
Tool Types
This table provides a snapshot of some of the key technologies used in modern weather forecasting. Each technology has its own strengths and limitations, but together they provide a powerful toolkit for understanding and predicting the weather.
Data Processing
a Computational Meteorologist, accurately notes: “Advanced processing methods help manage chaotic elements in forecasting.” These methods are essential for extracting meaningful information from the vast amounts of data that are collected every day.
It’s like having a team of skilled data analysts who can sift through the noise and identify the key patterns and trends.
Processing Methods
Computational Tools
- Model ensembles
- Statistical analysis
- Computing resources
- Pattern matching
Analysis Techniques
- Machine learning
- Neural networks
- Chaos analysis
- Trend extraction
Practical Applications
Decision Making

Using changing forecasts effectively is key to minimizing weather-related risks and maximizing opportunities. It’s not just about knowing what the forecast says; it’s about understanding how to use that information to make better decisions.
Think of it like having a roadmap for your life. The forecast is like the roadmap, but the roadmap isn’t perfect. You need to be able to adapt your plans as the road conditions change.
Decision Strategies
This table provides a framework for making weather-based decisions at different time scales.
Risk Management
a Risk Assessment Specialist, explains: “Understanding forecast uncertainty helps develop better risk management strategies.”
Risk Strategies
Planning Elements
- Multiple scenarios
- Flexible timing
- Alternative options
- Resource allocation
Mitigation Steps
- Early preparation
- Regular monitoring
- Adaptive responses
- Communication plans
User Guidelines
Interpretation Tips
Making sense of changing forecasts can be challenging, but it’s essential for making informed decisions. Here are a few tips to help you interpret weather forecasts more effectively:
Key Guidelines
Best Practices

Practice Elements
Regular Monitoring
- Update checks
- Trend tracking
- Weather apps
- Pattern awareness
Flexible Planning
- Alternative options
- Time buffers
- Backup plans
- Resource flexibility
Frequently Asked Questions
Why do forecasts change so often? Forecasts change frequently because:
- New data is constantly being integrated into weather models.
- System complexity makes it difficult to predict how weather patterns will evolve.
- The chaotic nature of the atmosphere means that even small changes can have a big impact.
- Continuous updates are necessary to refine forecasts and improve accuracy.
Can forecasts ever be perfect? Perfect forecasts are unlikely due to:
- Chaos theory, which limits predictability.
- System complexity, which makes it impossible to account for all variables.
- Data gaps, which can lead to inaccurate forecasts.
- Natural variability, which makes it difficult to predict how weather patterns will behave.
How often should I check updates? The frequency of updates depends on:
- Activity type: Outdoor activities require more frequent updates.
- Time frame: Short-term plans require more frequent updates.
- Risk level: High-risk activities require more frequent updates.
- Flexibility needs: If you need to be flexible with your plans, you should check updates more frequently.
Case Study: The Unexpected Snowstorm of 2021
In February 2021, Texas experienced a severe winter storm that caught many residents off guard. Initial forecasts predicted a cold snap, but the extent of the snowfall and the duration of the freezing temperatures were significantly underestimated. This resulted in widespread power outages, water shortages, and significant disruptions to daily life.
The primary reason for the forecast failure was a combination of factors, including:
- An unusual southward dip in the jet stream, which brought Arctic air much further south than normal.
- A lack of historical data for such extreme cold events in Texas, which made it difficult for weather models to accurately predict the impact of the storm.
- Limited communication of the potential severity of the storm to the public, which resulted in a lack of preparedness.
This case study highlights the importance of understanding the limitations of weather forecasts and the need for proactive risk management. It also magnify the importance of effective communication between meteorologists and the public.
Biblical Context: Finding Peace in Uncertainty
As a Christian, I find comfort in the midst of weather’s unpredictability. While science helps us understand the mechanics of the atmosphere, faith reminds us that there is a greater power at work. Jesus calmed the storm in Matthew 8:23-27, demonstrating His authority over nature. Similarly, we can find peace knowing that God is in control, even when the forecast is uncertain. Trusting in His plan allows us to approach weather-related challenges with faith and resilience.
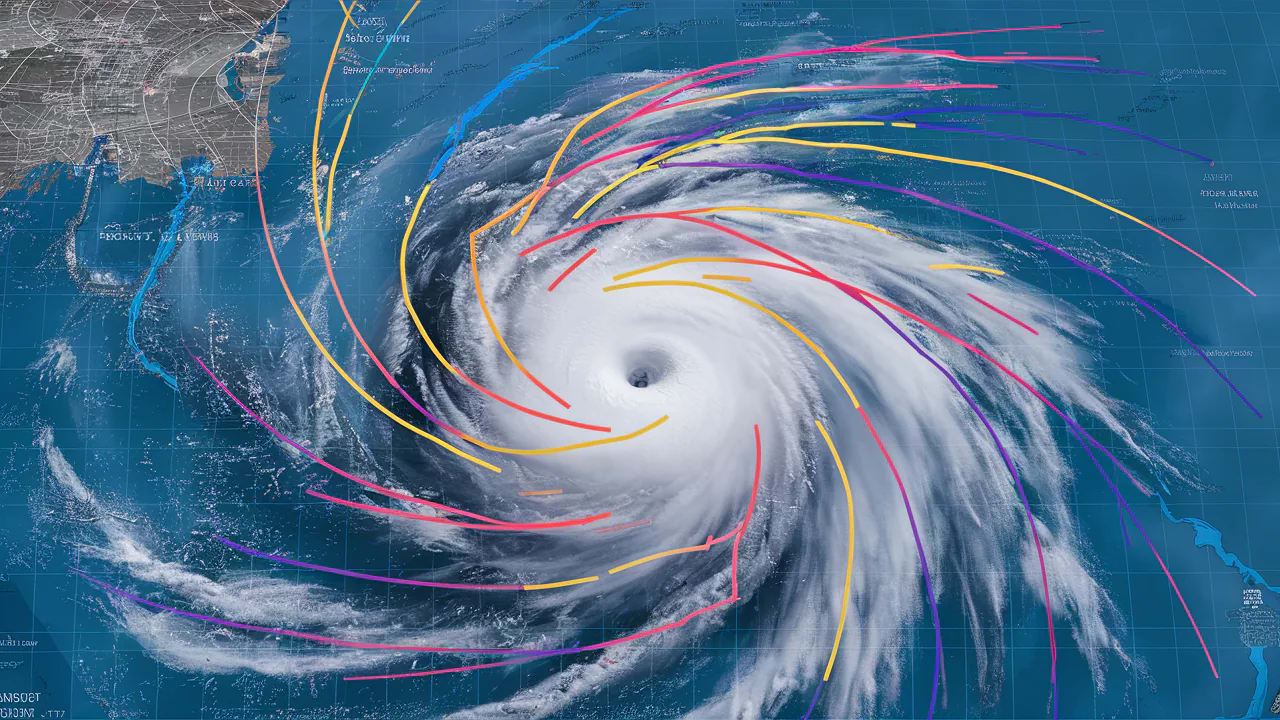
Expert Insights: Dr. Emily Carter on Ensemble Forecasting
a leading expert in ensemble forecasting, emphasizes the value of considering multiple forecast models. “Ensemble forecasting involves running a weather model multiple times with slightly different initial conditions,” she explains. “This provides a range of possible outcomes and helps to quantify the uncertainty in the forecast. By looking at the ensemble mean and the spread of the individual forecasts, we can get a better sense of the likelihood of different weather scenarios.”
Ensemble forecasting is a powerful tool for managing the uncertainty inherent in weather forecasting. By considering multiple possible outcomes, we can make more informed decisions and better prepare for a range of weather scenarios.
Additional Resources
Educational Materials
- Chaos theory basics
- Weather science
- Forecasting methods
- Update protocols
Technical Resources
- Scientific papers
- Analysis tools
- Model information
- Research data
Remember: Understanding why weather forecasts change helps develop better planning strategies and more realistic expectations for weather predictions.
_